In every issue, the “Auto Tech on Wheels†will be giving Master Technician readers his unique perspective on diagnostics, and real-world accounts of how he’s solved mysterious problems.
I was called in to a shop for a complaint of hesitation accompanied by an illuminated MIL on a 2000 Toyota Corolla with the 1.8L engine. The shop had already replaced the fuel filter, cleaned the injectors
and the MAF sensor and even sold an O2 sensor as a maintenance part replacement. The vehicle returned to the shop with the same symptoms. Nothing had changed except that the customer had lost patience with the still-illuminated MIL. The shop didn’t want to put any more money into the car without being 100% sure it would actually be repaired, so they decided to call me in for a second opinion.
I’m frequently asked how I can come to a shop and in just an hour or two solve problems that have eluded experienced technicians for days or even weeks. The key to my, or anyone’s, success is to keep going to any training that’s available. This makes it possible for you to understand the system that you’re diagnosing so you can apply the logic that guides you to do the correct tests in the correct sequence. This will lead to success. It’s also very important to have the best information and tools for the job at hand. Repairing vehicles quickly and efficiently can be compared to a tripod — each leg must help support the overall diagnostics. One of the legs is the information required for the specific vehicle. The second leg is the correct equipment for the job. The third leg is the ability of the technician to apply his or her understanding of the system in question. If any of these legs isn’t present, the diagnosis will fall to the ground in failure.
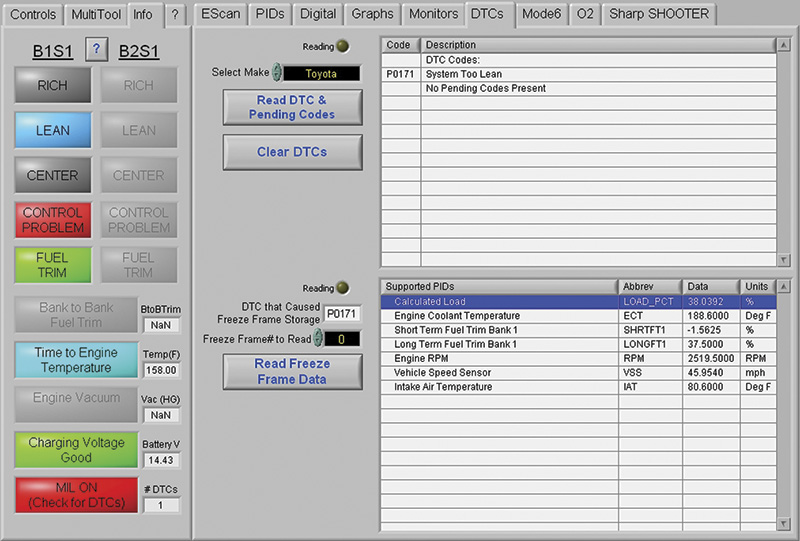
Now let’s get down with our diagnostic dilemma. I plugged my PC into the DLC. First, I pulled the diagnostic trouble codes (DTC), of which there was only one: PO171 (lean operation). There were no pending codes present. I then pulled the freeze frame so I could see what the operating conditions of the vehicle were when this DTC was set. This is very important when tracking down problems since these failing conditions have to be repeated several times in a row in order to lodge a DTC. Once a pending code is set, the PCM adjusts all the criteria so it is within 10% of the original pending code criteria before it will run the second DTC or testing program. This information arms the technician with the exact conditions that were present when the pending code matured into a DTC. By viewing the freeze frame data the operating conditions under which the vehicle failure occurred can be seen. Now, if needed, the tech can put the vehicle under the same operating conditions while monitoring the data.
By analyzing the freeze frame data (Figure 1) you can see that the vehicle was traveling under a 38%calculated load at about 46 MPH and 2,500 rpm. The long-term fuel trim (LFT) reached 37%. This was an indication that the PCM had a report from the oxygen sensor of a lean condition or low oxygen sensor voltage. When the oxygen sensor voltage drops below 0.45 the PCM commands more injector on time. It accomplishes this by fuel trim. Fuel trim is a modifier to the original fuel injection equation. In all MAF-equipped cars, the PCM takes in a signal (input) that tells it how much air (by weight not volume) is entering the engine. It then commands the injection on time (output) so the air/fuel mixture will be correct for the operating conditions of the power plant. The oxygen sensor reports the resultant air/fuel status to the PCM. The short-term fuel trim (SFT) then commands the injector on time in the opposite direction of the oxygen sensor report. If the report from the oxygen sensor is lean (low voltage) the fuel trim moves to a positive correction factor (adding fuel). If the report from the oxygen sensor is rich (high voltage) the fuel trim moves to a negative correction factor (subtracting fuel). This will allow the oxygen sensor to change its output and then start to move toward 0.45 V.
As the O2 voltage crosses 0.45 line the short-term fuel trim again changes its direction. This again moves the oxygen sensor in the opposite direction. When the O2 voltage moves from a high value (rich) to a low value (lean) and continues this cycle, it is an indication that the PCM has fuel control. Under these conditions the PCM keeps the air/fuel ratio at 14.7 to 1 (stoichiometric). When the PCM loses this fuel control and the oxygen sensor voltage drops below or goes above 0.45 for an extended period of time, the fuel trim will try to counter the oxygen sensor voltage. When short-term fuel trim crosses a predetermined point, long-term fuel trim will start to move in the opposite direction of the oxygen sensor voltage. The long-term fuel trim will continue its movement until the oxygen sensor voltage crosses the 0.45 voltage threshold or the long-term fuel trim hits its programmed limit. Once the fuel trim’s movement goes beyond its limit the PCM will store a failure. In this case it stored its lean limit. In other words, the oxygen sensor’s voltage remained below 0.45 volts (lean) long enough for the PCM to add enough long-term fuel trim to the base fuel calculation to set a code. This could be caused by a fuel delivery, injector or oxygen sensor problem, or even a MAF sensor signal that’s out of range.
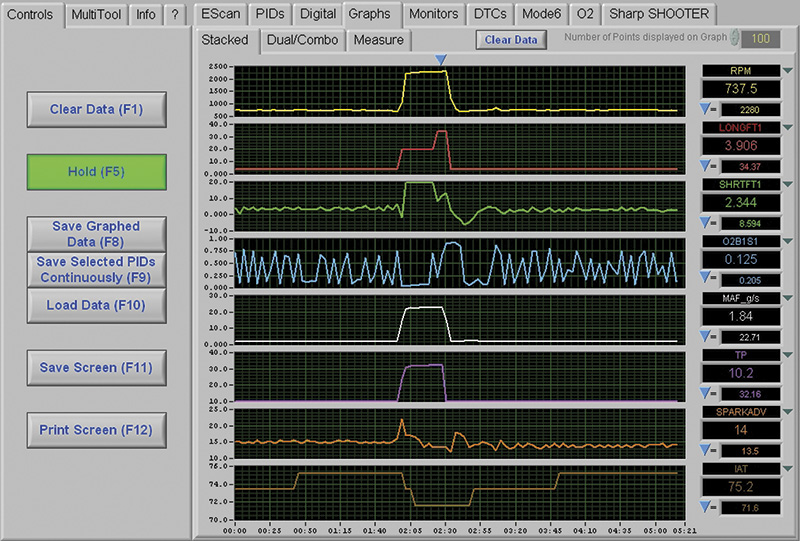
To find the cause of the fuel control problem I engaged the graphing mode selecting the appropriate PIDs. I power-braked the engine in drive at about 2,200 rpm (Figure 2). I could immediately see the graph for the O2 sensor flatten to about 100 mV. At the same time, the trims rose to almost 20% before the LFT trim rose again to about 34% to get the O2 sensor to start switching. The graphing of PIDs is very helpful to get a good visual of what is actually going on. It allows you to get a better understanding of how the PIDs hold a relationship with one another so that you can better hone your skills to come up with a proper diagnosis. Okay, I now confirmed the lean problem, but I still needed to dig deeper.
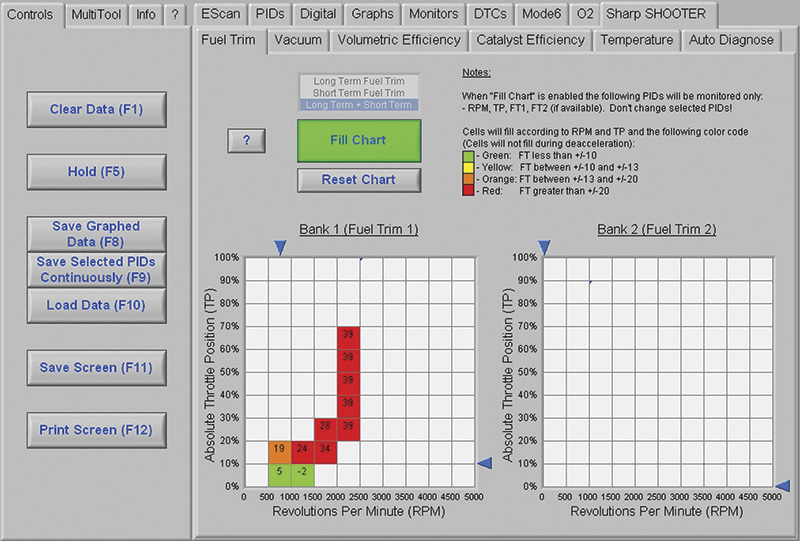
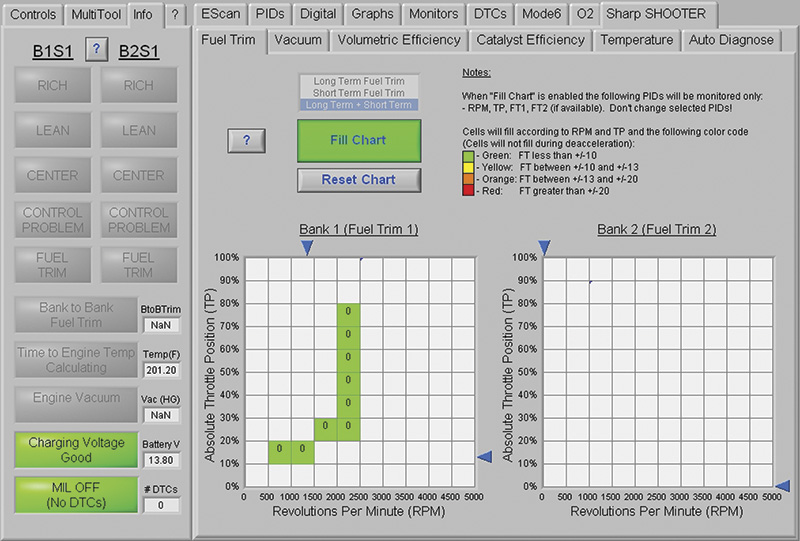
I next moved on to the EScan tool I was using has a “Sharp Shooter.†Here is where the action begins and the excitement increases. I first selected the Fuel Trim grid to again verify the trim problem. This grid is designed to fill cell blocks, which mimics the way the PCM would monitor cell blocks for proper fuel control. The visual aspects of the color grid reveal the fuel trim problem at a glance. By again power-braking the vehicle at about 2,500 rpm (Figure 3), I saw the same results as in the graphing mode, but with a quicker understanding of where the problem lies just by looking at the color of the blocks — green indicates that the fuel trims are good, while yellow, orange, and red are indications of a fuel trim problem.
The engine was not missing as if it had partially clogged injectors, but bogged down under a load as if it had a low-output fuel pump or a bad MAF sensor. Rather than spend the time hooking up a fuel gauge, I moved on to the next Sharpshooter test, that for Volumetric Efficiency.
An internal combustion engine is only an air pump. How much air the engine can pump can tell you a lot about its condition. If there is an intake or exhaust restriction, or the camshaft is out of time, the amount of air the engine is capable of pumping will drop. This efficiency can be calculated if you know the engine size, engine rpm, and the barometric pressure. This equation is referred to as the volumetric efficiency of the engine.
The EScan is set up to take all the math out of figuring volumetric efficiency. So, you basically plug in the engine size and it does the rest. I plugged in the 1.8L engine size and allowed the tool to calculate the TPS% and set myself up for a test drive. It is important to drive the vehicle under a load at WOT from a dead stop to get an accurate reading.
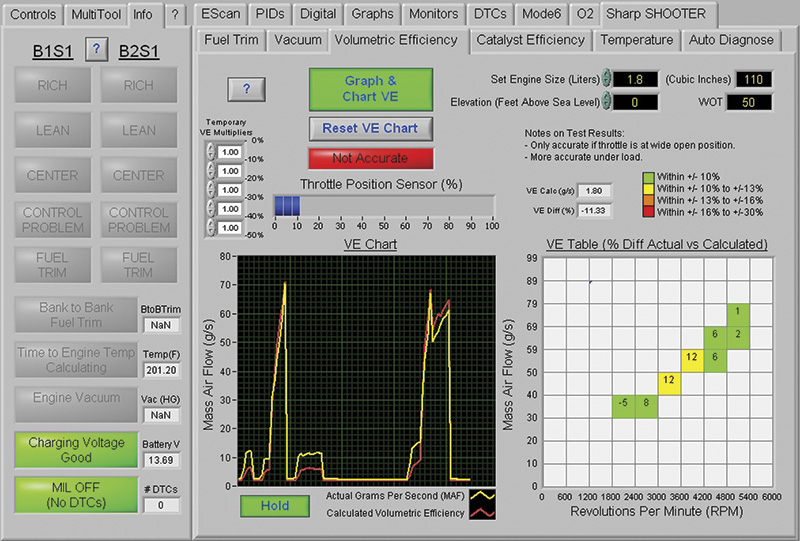
The tool graphs the expected (red line) and actual (yellow line) readings as you drive the vehicle. I made three hard accelerations from a dead stop (Figure 4) and you can see immediately that this Corolla had a volumetric efficiency problem. The VE table was showing readings that were low by about 30%, indicated by the red cells. Knowing this was a fuel trim problem ruled out a clogged exhaust or valve train efficiency trouble. If the volumetric efficiency of the engine was low and the MAF sensor had reported the correct airflow for this engine,
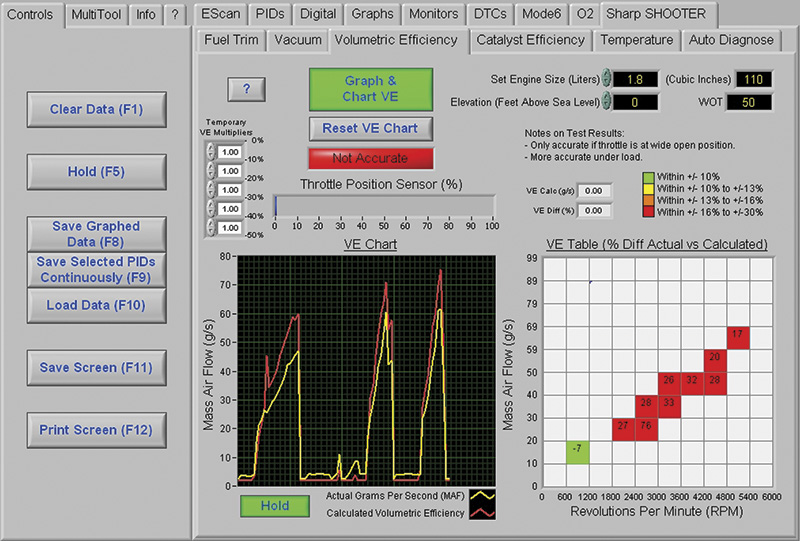
the fuel trim chart would have been green. This indicates that the PCM did not need to correct the original fuel injection equation. Since the fuel trim chart was red, this was an indication that the trim had to change the original fuel equation and add fuel to try to maintain the proper air/fuel mixture. Since the VE showed a very low reading and the trim chart showed very large corrections, this had to be MAF sensor related and not a fuel pump problem.
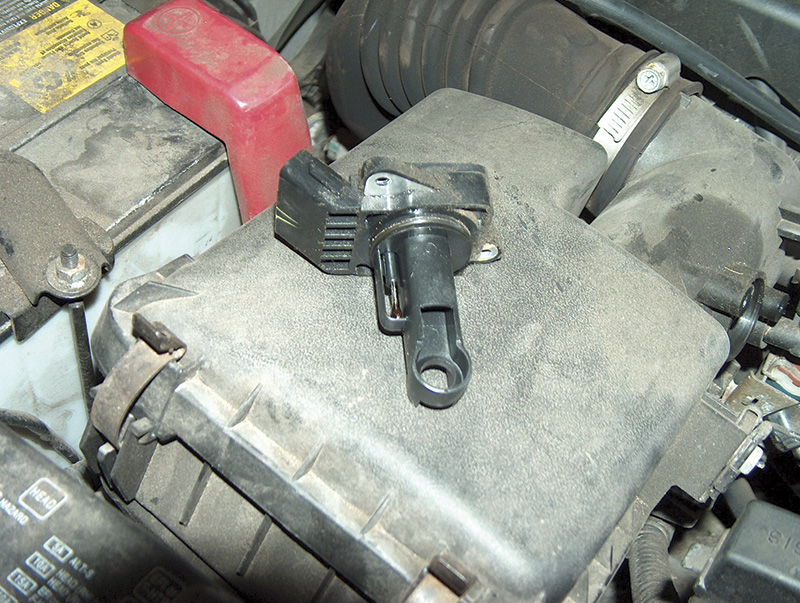
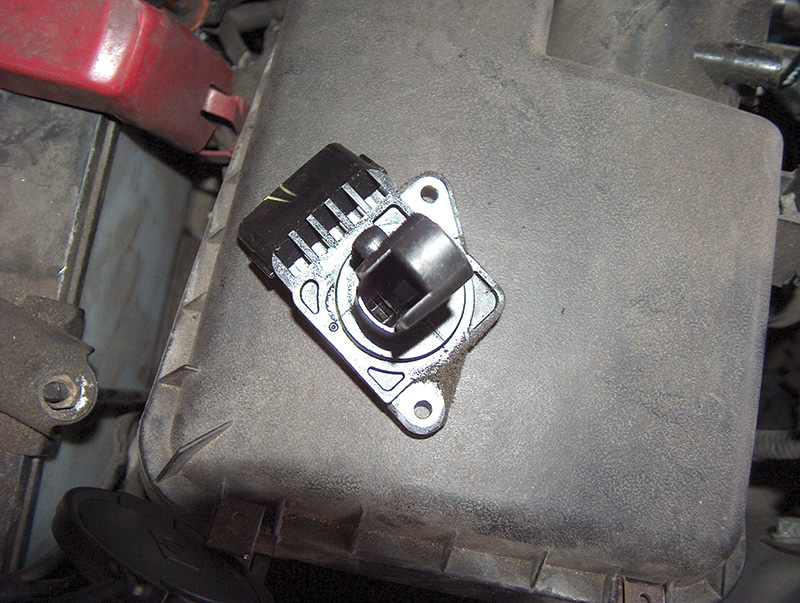
I removed the MAF sensor and inspected the air cleaner housing and duct for any restrictions or leaks and found none. Looking at a MAF sensor (Figure 5), many people get confused by the intake air temperature-sensing device on the outside and mistake it for the MAF sensing element. They clean the intake air temperature-sensing unit and then reinstall the sensor in the MAF sensor housing. This is just what this shop had done. By looking through the top of the sensor (Figure 6), you can see the MAF sensing element. This one was still very dirty, so I blasted it with electrical cleaner.
After the MAF was truly cleaned, I removed the PCM battery fuse to reset the fuel trims back to zero. I now went back to the Volumetric Efficiency test and drove the car again. The results in the graph (Figure 7) were night and day. The calculated and actual readings were basically the same, and the VE table showed readings within the 10% range, shown in green, and the car ran great. To verify my fix, I loaded the Fuel Trim chart (Figure 8), and you can see those results were dramatic as well. The shop had come very close to replacing the MAF sensor, which would have been another unnecessary part, but it would have eliminated the problem even though all that was really needed was cleaning.
I can only tell you that as technology keeps advancing and vehicles become harder to repair, it’s more important than ever to have all three legs of the diagnostic tripod intact when working on modern vehicles. I value my time and it is the visual associations that PC software of this type can offer that enhance your diagnostic strategies to get to the root of the problems quickly, while learning in the process. I hope this story has enlightened you to better understand how a simple sensor can set off codes unrelated to itself and take you on a diagnostic adventure!


0 Comments