The phone rings
A call for help echoes over the lines.
“I have this ’94 626 in the bay. Its V6 dies when it drops to idle after revving up. And I’m looking at this sawtooth signal that changes to a digital signal as the car dies.â€
A sawtooth signal dying into a digital signal? That sounded strange.
“Are you sure? What signal is it?†I asked.
“Well, it has to be the rpm signal. I’ve scoped every wire at the distributor and this is the only one with a pattern like a magnetic pickup.â€
After a few more questions, I suspected I knew what he was talking about. And now I could help. But let’s backtrack a bit….

Invitation to the Puzzle

I was excited about investigating this problem, including the circumstances that lead up to the phone call and the steps that followed it. I’ve used this unique signal as an example in my seminars, so I saw this as an opportunity to test the techniques and diagnostic strategies that I teach.
The first problem occurred when the caller called the waveform a “sawtooth signal.â€
Consider the story so far:
- The mechanic wanted to see the engine rpm signal from the pulse generator in the distributor.
- The printed wiring diagram he had did not suggest any clear shape to expect for the scope trace (Figure 3) nor what terminal to check.
- The mechanic scoped all the wires at the distributor trying to identify a pulse generator signal.
- The only signal that looked like a pulse generator signal, the one he spoke of on the phone, appears in Figure 1.
- The Figure 1 signal he found changed pattern to the one in Figure 2 just as the engine lost fuel or spark and died. The B-trace in Figure 2 is the ignition primary negative terminal.
Some Wiring Diagram!


Often during a problem diagnosis, we can simply print out a circuit’s wiring diagram and that gives us enough information to get to work. Figure 3 is a diagram the mechanic had of the distributor circuit from one of the major automotive technical information services. Each of them has areas they cover better or worse than the others, but in this case the diagram supplied offered almost no information, and the rest of the diagram wasn’t any better. But one of the joys of working with a lab scope and waveforms is: We can start probing until we find the signal that looks about like what we expect. For example, if we want to find an injector signal at an unfamiliar ECM, we can just back-probe terminals until we find one that looks like an injector slope. Nothing else will have the same characteristic shape.
The First Clue
Our caller began with this diagram and the assumption the distributor had at least one and probably two magnetic pulse generators. The waveform in Figure 1 looked more like a pulse generator waveform on the scope than anything the other terminals displayed. Aggravating the situation, though, the scope’s voltage and time settings make the pulses look narrow and tall. If you combine this with normal diagnostic expectations, the press of time and many other normal shopwork factors, it is easy to see how confusion sets in. Nonetheless, the signal decay pattern was hardly anything we’d expect. Can we solve the engine-dying problem with nothing more than the obviously inadequate technical information the mechanic had on hand, the patterns he saw on his scope and our background knowledge of the electronics probably involved?
Well, suppose this signal is a pulse generator signal. When the car died the pattern turned into what we see in Figure 2.
Now that is clearly a digital signal. What’s going on?
A Pause in the Investigation

At this point, we can do various things as a next step. In the information presented so far there have been plenty of red flags, plenty of red herrings and plenty of information to lead to a next step that yields more useful clues. But the risk is we set our minds on a certain track and can’t get off it. If we unconsciously adopt unspoken and untested assumptions, eventually we find ourselves faced with something we can’t understand, and there we get stuck — fixated in tunnel vision. We get stuck and can’t understand the problem because we’ve misconstrued it in the first place.
It’s similar to walking down a very long hallway, only to find a locked door. All too often, our first instinct is to keep heading in that direction by forcing or breaking down the door! After all, that’s where we want to go, isn’t it? Well, accurate diagnosis does not work that way. Diagnosis is about letting the evidence, the clues, determine how we see the problem, not letting our assumptions shape our thoughts.
Only thus can we turn the unknown into the known, and that won’t happen unless we learn to take a step back and look for the key! Or even look for a different and unlocked door, a door behind which no unexamined assumptions lie.
In this situation, there are multiple approaches to finding the actual problem. But generally what we need to do is to get more detailed information about the circuit if we can (either from better wiring diagrams or from our own testing), to analyze the shape of the waveform without pigeonholing it first and to look for basic system connections and relationships. Here’s what I mean:
Back to the Death Scene
Let’s start over by re-describing the signal. You know, if you don’t see the important parts of the signal for yourself, it certainly will be tough to describe it to someone else. Even worse, if you see elements of the signal that are in your mind rather than in the signal itself, you’re most unlikely to sort things out correctly or to make the conditions clear to someone else.
Let’s re-start by examining our first assumption — there had to be a pulse generator signal. Put your finger over the top ramping portion of the signal (Figure 1). What do you see? A repetitive digital signal, an on-off, not a jagged sawtooth pattern. Now remove your finger. Add what you now see to what you just saw. It’s a repetitive digital signal with an upward ramping top (RDS w/URT).
Compare that with a sharp-cornered sawtooth waveform or a meandering sine-wave pattern. Do pulse generators send repetitive digital signals with an upward ramping top? No, not unless something else, some other electronic component, has ‘conditioned’ or re-shaped the original signal in some funny way.
Now, what do we see in Figure 2, watching the same sensor, the same terminal, just as the engine dies? Great! It’s a regular on-off digital signal.
So what are the important things we’ve learned from our re-examination of the scope patterns? The terminal sends a digital signal that changes shape in direct relationship to the car’s dying. So the next question is: Does this pattern change cause the problem, or does the problem cause the pattern change?

Applying Existing Knowledge
To answer that question we need to know what the signal is, even though we have almost nothing useful in the way of a wiring diagram. We don’t even know what the different distributor terminals connect to internally or externally. But since it is a repetitive signal into or out of the distributor, it must be a crank, cam, timing control, primary ignition or ignition confirmation signal. It can’t be much else. What else would involve the distributor? No doubt, one of those signals sequences the fuel injection, but that must work or the engine wouldn’t run at all.
What is the key word here? Relationships! Find them and use them to solve the puzzle! The main relationship here is between when the engine dies and when the signal changes. So it’s likely the ignition or the injectors are shutting down just as the signal changes.
Since we are at the distributor, let’s look at the ignition primary. And while examining that circuit, maybe we can observe more relationships between our RDS w/URT pattern and the problem. Remember, since it goes into the distributor it must be in sync to some extent.

Figure 3 is very revealing. What relationships do you see? Our RDS w/URT pattern relates directly to the frequency, and the upward ramping top (URT) relates directly to the dwell of the ignition primary. This must be the timing control pulse for the ignition driver! How do we know that for sure? Because we understand the relationship of the two signals. Nothing else in the vehicle electric system, still less anything connected to the distributor, would vary in just those ways.
Diagnosis by Signal-Shape
There is another way to figure out this system and problem without a wiring diagram. What components in automotive electrical circuits make ramping signals? Variable resistors and coils and almost nothing else.
Are there any variable resistors in the Mazda 626 ignition system? Probably not, but there is certainly at least one coil — specifically the ignition coil. We can use the lab scope to check the two signals and see whether there is, in fact, any such relationship.

Figure 4 shows what we found. This must be a timing control pulse because these two signals appear to be sharing something. Look back at Figure 2. The scope captured this waveform just as the engine died. The blue signal, the B-trace, is the ignition primary. What changed in our RDS w/URT? It became a RDS with a flat top! Now there should be no doubt about which component generated this signal and the relationships it shares with the rest of the ignition system.
Documents, But After-the-Fact
Later I found a much better wiring diagram from a different information system (Figure 5). What a difference! This one is a high tech dream! It answers all of the questions we had earlier. There is enough information to determine what each signal should look like and the basic expected relationships, information, however, we were able to reason out from the scope traces and what we already know of ignition systems and electronics.
First, there are no analog pulses because the distributor uses a pair of Hall-effect sensors, each producing a conditioned digital signal. There aren’t any inductive sensors at all. Second, there is a definite relationship between the timing control pulse and the primary ignition: They both share a transistor emitter/ground path.
Signal Shape Savvy

Figure 6 shows a basic bipolar NPN transistor as the ignition driver. The diagram is oversimplified, but the important thing to notice, supported by the scoped patterns of the Igniter signal, is that it is a current-controlled device.
Since it is NPN we know that it takes a positive voltage at the base to turn on the transistor. This means that current needs to flow though the emitter/base junction. The ‘high’ end of the igniter signal toggles this semiconductor ‘switch.’
Once the transistor turns on, current flows through the emitter-collector-coil pathway. Because of the coil’s electrical reluctance, this current builds slowly, in a ramp. As the current increases, the resistance (not the reluctance!) of the shared pathway increases directly, and we see a larger voltage drop. Both the ignition and the control ramp up.
Still More in the Patterns

Let’s look at Figure 2 again. What does this signal tell you? The igniter control signal is still there, but we see the primary ignition signal flat-lined. The flat line could be because power to the coil is gone, because the coil is open or because there is an open on the power side of the test point. It could be because the driver is shorting the coil to ground all the time or because there is a short somewhere else. We don’t know that in particular, but we know there can’t be a spark.
What voltage would the timing control signal be with an open coil? Look again at Figure 1, the initial ramp voltage is about 2 volts, and the peak is about 3.75 volts. In Figure 2, the peak is steady at 3 volts and the ground is elevated a little. What’s more, there’s no ramp. Jump over to Figure 7 and notice that the ignition signal is not down to ground either. Is the smoke about to leak out of these wires? How could you find out? Put a current probe between the transistor and its ground.
On the Road Again—
The repair was much less interesting than the diagnosis, because it turns out the only part you can get is the complete distributor, with all the suspect components new.
And Back to Work—
When you run into an unknown problem or an unfamiliar system, step back and assess what you do know and what you don’t. You do know (or can learn!) electronics; you do know how most ignition and fuel systems work – the physics, fuel and purpose are the same for every carmaker, so the electronics are pretty similar, too. Next, use your overall understanding to determine what else you need to find out. Then experiment and research until you do.
Learn to ask the right questions and to avoid thinking you know things you don’t. Look for the clues and be aware of where they lead you. Learn to distinguish what is important from the incidental. Use each diagnosis as a learning experience, not only to learn about a particular car or system, but also to learn how to learn, to teach yourself to learn.
What’s Down the Hall?
We see Hall-effect signal generators in many components of engine management systems, and everyone knows they have metal shutters cutting through magnetic fields to somehow trigger the news that a distributor or camshaft has turned to a precise location. But what’s going on inside the Hall-effect sensor? Just how does it manage this on-off switch internally?
Figure A shows a small current flowing sideways through a semiconductor chip, the Hall-element. This current comes from the computer, aroused to electric activity by the ignition key and the battery. As long as the current flows in parallel lines through the element, there is no change of voltage on the sides of the chip.
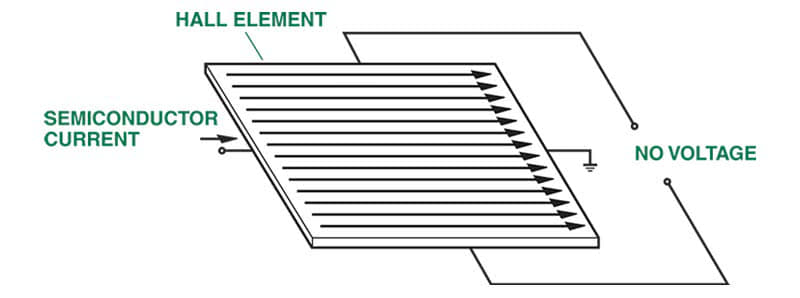
Figure B shows what happens to the electric current path if a magnetic field suddenly impinges on the chip: the current bulges to either side in response to the force of the magnetism. This magnetic field, of course, switches ‘on and off’ by the presence or absence of the metal shutter between the electromagnet and the Hall-element; in between, the shutter blocks the magnetism; when the slot appears, the magnetism reaches the element and bends the current path.
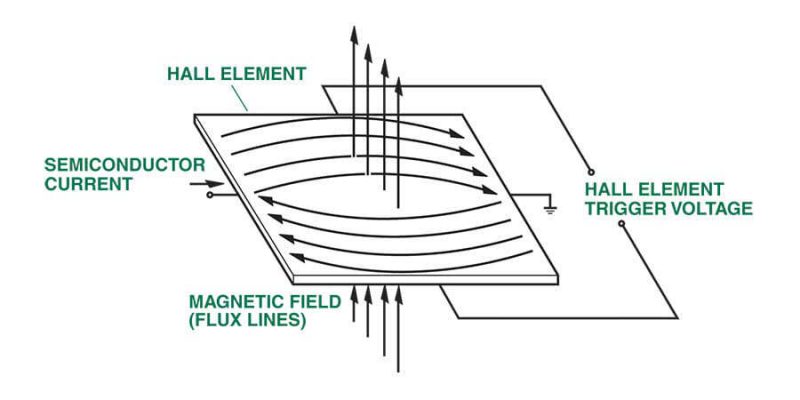
But when the current path bends, voltage suddenly appears on the sides of the element, a very small voltage, but enough to trigger an amplifier transistor toggling the five-volt reference signal on and off as the vanes pass. The elegant aspect of the Hall-effect sensor is its insensitivity to speed. Unlike an inductive sensor, there is no bottom threshold at which the signal voltage will occur: With a Hall-effect sensor, you could turn a distributor shaft at a clock’s hour-hand speed and get a perfectly sharp digital signal.
But when the current path bends, voltage suddenly appears on the sides of the element, a very small voltage, but enough to trigger an amplifier transistor toggling the five-volt reference signal on and off as the vanes pass. The elegant aspect of the Hall-effect sensor is its insensitivity to speed. Unlike an inductive sensor, there is no bottom threshold at which the signal voltage will occur: With a Hall-effect sensor, you could turn a distributor shaft at a clock’s hour-hand speed and get a perfectly sharp digital signal.
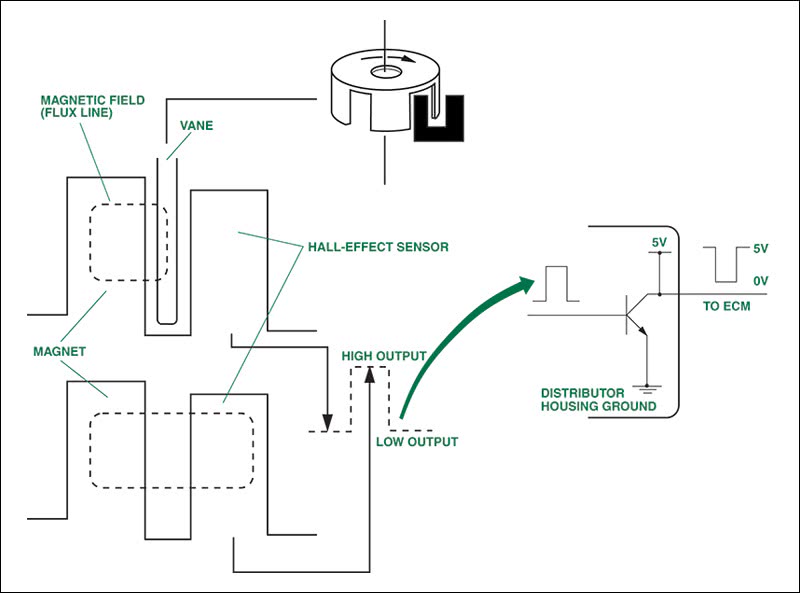
Figure C shows the signal amplification circuitry in schematic form.
by Jorge Menchu


0 Comments