
Smart power control is becoming far more common. Knowing the basic principles of these control methods will make diagnosis easier.
The exponential advancement in vehicle systems technology in recent years has led to the emergence of “smart power†control of automotive motors, pumps, solenoids and other devices, delivering increased operating efficiency and component life. Read on to explore what it is, how it works and seriously raise your diagnostic game!
So, what is “Smart Power�
Back when vehicles first started showing up with electronically controlled systems, such as computer-controlled carburetors and early electronic fuel injection systems, traditional mechanical fuel pumps and other devices were replaced with electric motors, electric injectors and computers to control them.
These were relatively simple systems: A fuel pump, for example, would have the ECM (Engine Control Module) switch ground to actuate a fuel pump relay, which in turn would energize the fuel pump with system voltage, causing it to run. The pump was energized anytime the engine was running, and would stay running at 100 percent for the entire drive cycle. We considered strategies such as the “2-second key-on prime†and emergency fuel shutoff when engine speed reference was lost as “high tech.†Running full bore all the time, these motors consumed a good amount of energy while running at about 78-85 percent efficiency. Although designed for a long life, eventually they wore out because they were always running at 100 percent.
Enter the era of high-pressure injection systems: In these systems, the fueling demands are significantly different than that of a low-pressure EFI system. Not only are higher fuel pressures required, but somewhat higher volumes for heavy load conditions must be supplied. In a stratified-charge engine, used by Mercedes-Benz in Europe but not in the United States, an injector may need to fire up to five times per engine stroke (with an average of three).
A variable-speed pump which, under high load, could be ramped up to full pressure and volume, and also be run at minimal pressure and volume in deceleration mode (e.g., injection cutoff) would be an optimal way of supplying fuel. Controlling the energy consumption of this major consumer would have a noticeable impact on the energy used by the vehicle, resulting in improved fuel economy and reduced wear and tear on the fuel supply components. But how to do this?
Using a simple on-off relay to control the fuel pump precludes varying the pump’s speed, so Mercedes-Benz engineers turned to technologies used for the control of very large industrial motors: Smart Power design. This is really a high-tech solution to a difficult problem, and knowing how it all works will serve you well.
PWM
Pulse Width Modulation (PWM) is method of switching (cycling) voltage to an electrical load on and off at relatively high speed (frequency). If you wanted to control the brightness of a light bulb (the electrical load) for example, you might try to flick it on and off by hand, but due to the limits of the human body, you couldn’t do this fast enough to avoid seeing the bulb flicker. But get some electronics involved – say, a household dimmer switch, which operates much faster – and the light doesn’t seem to flicker any more, just its brightness is reduced. Since there is some ‘off’ time, less energy is supplied. Less energy means less brightness.
In its basic form, PWM is DC power switched on and off very rapidly, created by a control circuit, usually a microcontroller (a computer-on-a-chip). This controller generates low-power control signals. These signals trigger a ‘driver’ circuit using large solid-state devices capable of handling both the necessary electrical current and switching it on and off thousands of times each second.
Way back in the day, a DC motor’s speed was controlled by simply reducing the voltage to the motor. Think of a ballast resistor pack for the HVAC blower motor in a W201 model: Four blower speeds created by different resistance values, which varied the voltage to the motor. Today, instead of wasting that energy to heat in a resistor pack, we use PWM control, which has the added value of a nearly infinite speed control capability.
The basic idea is that if the power is on for just a small portion of the time, the energy delivered to the load is small; conversely, larger portions of ‘on’ time deliver more energy, just like that light dimmer in your house. If the frequency is high enough – 10 to 30 kHz are not uncommon – the load (such as an engine cooling fan) averages out the energy and runs just as if it were receiving a reduced DC voltage. The high frequencies, usually selected to be above the hearing range of humans, have two reasons: So the circuit doesn’t generate noise, and because higher frequencies can use smaller (and less costly) electronic controls. Maybe you’ve used a variable-speed drill and heard the ‘whine’ noise at very low speeds?
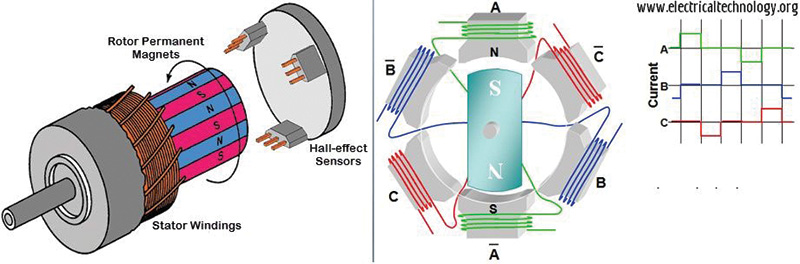
In the world of DC motors, there are brushed and brushless types. Brushless motors, which use powerful magnets instead of electrical coils on the rotor, are much more efficient than brushed motors – but also cost more. They are also somewhat better to use as variable-speed motors.
Varying the duty cycle of a motor’s power supply (Pulse-Width Modulation) is ideal for controlling DC brushless motors. The basic principle is to deliver pulsed (variable) voltage to the stator (outer) winding coils of the motor at a high frequency, which creates a magnetic force from each coil, driving the permanent magnet poles on the rotor, causing it to turn. The voltage can be reversed, turning the motor in the other direction.
Changing the average energy (current and voltage) delivered to the motor affects the amount of power the motor can produce, changing its speed for a given load. In some cases it is also an advantage to change the drive frequency as well, but this has a minimal effect upon the speed of a brushless DC motor.
Duty Cycle
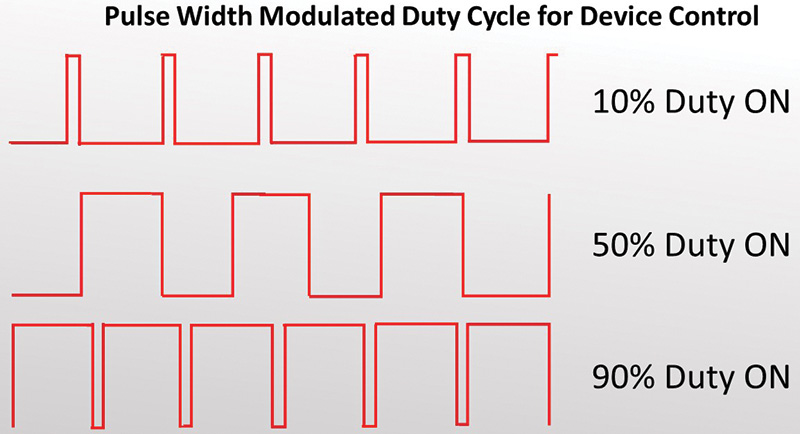
Duty Cycle is defined as the signal’s percentage of ON time as compared the ON plus OFF time. For example, a signal that is on for 1 microsecond and off 9 microseconds would have a 10 percent duty cycle. This means that a 0 percent duty cycle would be completely off and a 100 percent duty cycle would be full on. While that describes a circuit that controls the positive voltage (‘high-side switching’), in circuits that switch the ground side on and off (‘low-side switching’) the numbers are reversed, because a ground signal turns the circuit on. In other words, for low-side switching circuits, 0 percent duty cycle is full on, and a 100 percent duty cycle is off.
Note: A good indicator of whether you are dealing with a high-side (positive voltage) device or a low-side (ground-controlled) device is that, generally, low-side devices will have a direct wire to battery voltage (possibly fed through a relay or fuse, for example an O2 sensor heater) while a high-side device will generally have a direct wire to ground. Of course, the wiring diagram should be consulted to be sure.
When PWM technology is used to power devices, there is normally some form of feedback to the control module via sensors or current monitoring. This allows the computer to sense and react to changing conditions, hence the term “Smart Powerâ€, as we know it in driveability applications. For example, as engine coolant temperature increases, the electric cooling fan is commanded to run faster.
Technicians would typically be able to see the sensor data with a scan tool such as the Actual Values screen in XENTRY Diagnostics, perhaps in the form of a motor current or speed, pressure, temperature or some other value that needs to be controlled.
Frequency Control
While PWM speed control of an engine cooling fan has been in use for several years, new for automotive applications are 3-phase AC motors. Here, the drive current and voltage are nearly constant, while the frequency of each phase is varied. The motor winding for each phase can be made to attract or repel the windings on the rotor, or be even locked in position by supplying zero-frequency voltage (which is DC). So as the frequency increases, so does the motor speed. Also, by varying the sequence of the three phases, the motor’s direction can be reversed. This isn’t PWM, but instead a variable-frequency drive.
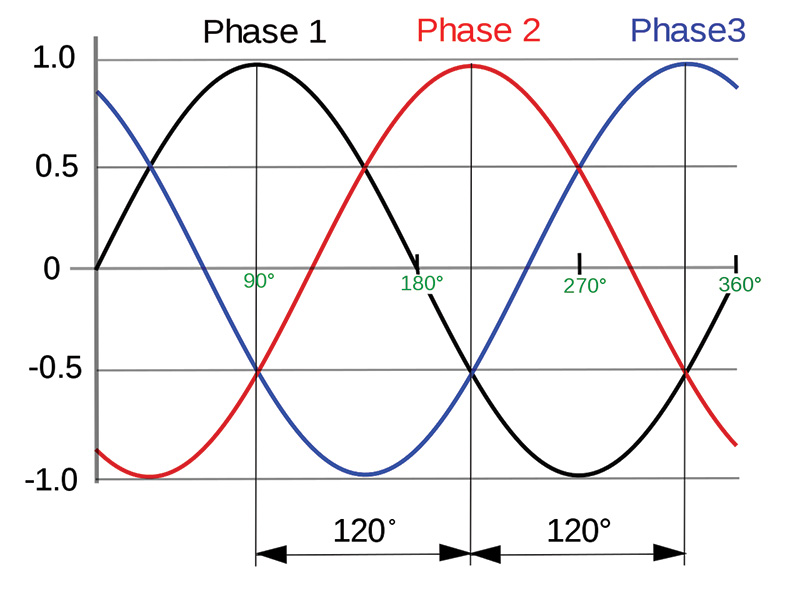
This, for example, is how an electric vehicle (EV) drive motor operates – the accelerator pedal input is used to vary the motor drive frequency output between zero and several kilohertz. Other 3-phase AC motors in newer Mercedes-Benz vehicles include the 3-phase fuel pump and the throttle control motor. Using three phases means we need each phase to be 120 degrees – both mechanically and electrically – apart for the motor to operate properly.
So, while the DC-based PWM control uses a pulsed DC voltage with a varying duty cycle to control the motor speed, 3-phase AC motor’s speed is controlled by varying the frequency of the AC drive waveform. Some PWM is also used, in this case to control the motor’s current (and therefore power output). We have already see how PWM works. To help you better understand this 3-phase AC speed control, let’s look at a case study: The 3-phase AC fuel pump in a 2015 Mercedes-Benz ML350.
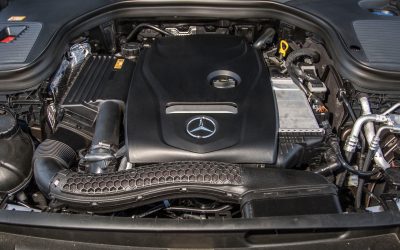
Test Subject: 2015 Mercedes-Benz ML350
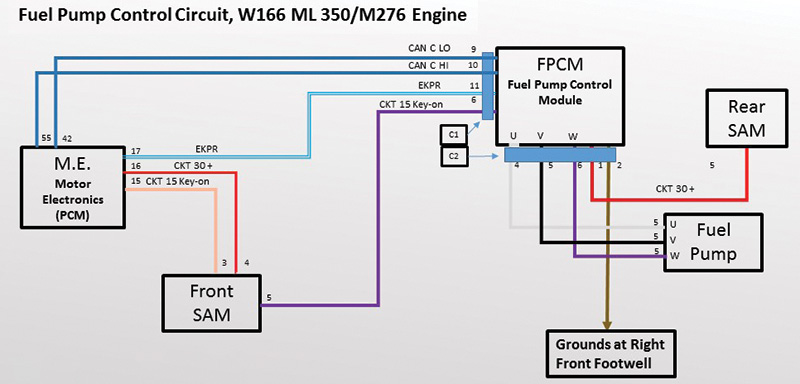
In the ML350 used in this article, we used an 8-channel lab scope to monitor several relevant signals. At the Fuel Pump Control Module, located in the spare tire well, three of the ‘scope channels (red, yellow and green) were connected to the three variable-frequency motor drive signals (known in the industry, and here, as U, V and W – see the image showing the circuit). A fourth channel – blue – was connected to a Current clamp to monitor motor current on just one of the motor’s three phases. You can see just how the connections were made, which involved back-probing the electrical connector, in the photo nearby.
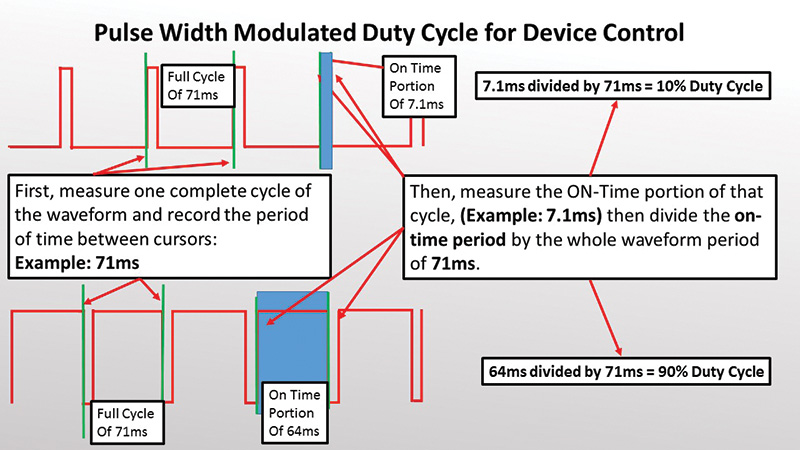
Let’s look at some live scope captures of the 3-phase fuel pump control system in this 2015 ML350 with an M276 Gasoline Direct Injection engine to visualize the 3-phase control. Using a lab scope in diagnosis allows the technician to see the three phases being fed to the pump, with a visual indication if any of the phases are not symmetrical with the others. In a PWM circuit, as we saw previously, the actual duty cycle can be measured. Not every diagnosis needs an oscilloscope, and indeed not every technician will learn how to use one, but those that do will have a distinct advantage.
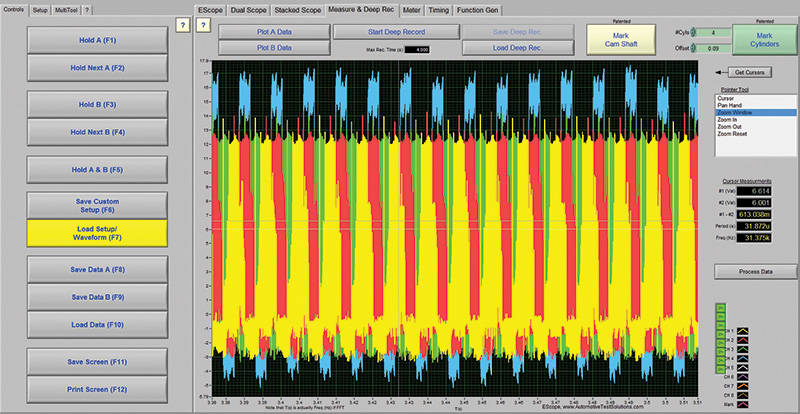
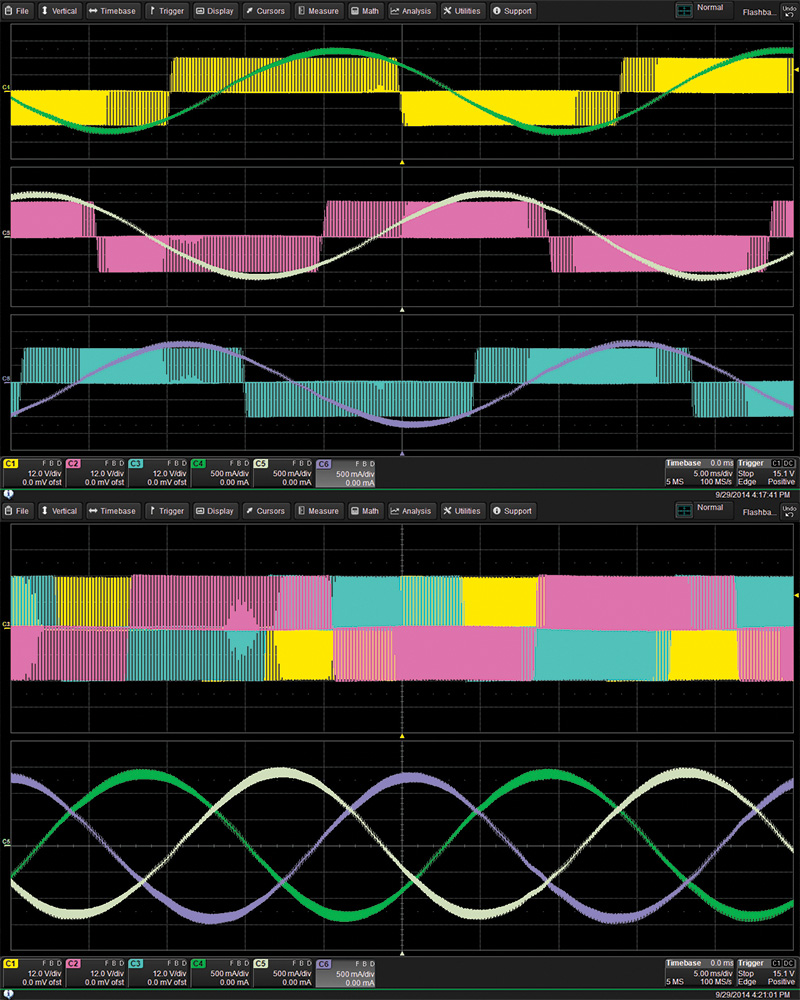
Have a close look at the oscilloscope image, showing the four signals we are monitoring. We can see that the voltage is nearly constant for each of the phases (yellow, red, green). Because we have overlaid all three phases atop each other, it appears as if the voltages change – for example, the yellow signal as the red becomes dominant – but in reality that is an illusion caused by the way the scope displays signals. We are showing this so you can see what your scope will usually show you. The image below, taken from a leading test instrument manufacturer’s site, shows 3-phase motor signals, but separated from each other for clarity, so you can see what we mean.
Also note that the voltage to each phase is pulsed: As mentioned, this is a form of PWM, but used for power control instead of speed control: When the fuel pump doesn’t need to pump so much fuel, we can cut back on the energy used using PWM. Smart control indeed.
The best part of using a scope instead of a scan tool is that you can actually see the electrical behavior of the driver, the wiring and the load all at the same time. This can help quickly isolate what the problem is in the circuit.
You can zoom in even more from here and measure the duty cycle and frequency of the motor control voltage. This can confirm or disprove that the motor is working as commanded.

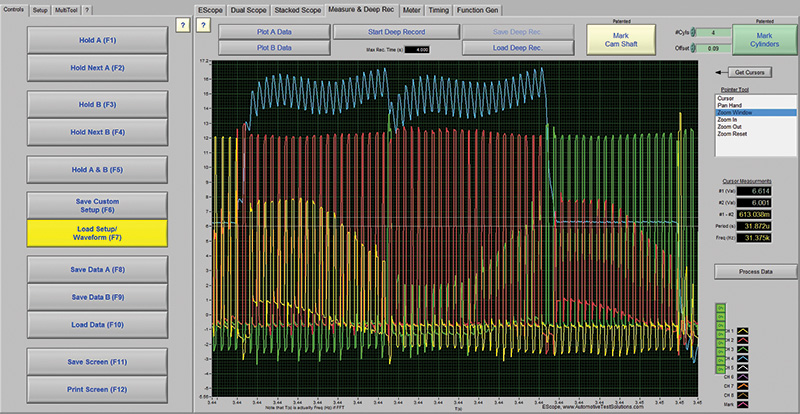
Have a closer look at the image that shows mostly yellow, at the bottom of the previous page. Notice how the current (blue) changes from left to right. What you are seeing here is how the motor current changes with demand: After a period of idling, we see the current jump up as the engine speed is increased to 1500 RPM. It then drops off once the engine is at constant speed, only to jump up again as speed is increased to 3000 RPM. This confirms proper operation of the whole system.
We took some detailed measurements of all this: During idle at 650 RPM, the fuel pump operated at a 28 percent duty cycle and current was 18 to 19 amps, turning the pump at about 6,200 RPM. At an engine speed of 1,500 RPM, duty cycle was 43 percent, current draw 21 amps and the pump turned about 7,500 RPM. Finally, at an engine speed of 3,000 RPM we measured a 47 percent duty cycle, 23 amps and 8,350 pump RPM.
At the same time, the PWM frequency changed from 10.37 kHz at idle, to 12.52 kHz at 1500 RPM and 14.02 kHz at 3000 RPM, demonstrating how drive frequency changes the pump’s speed (the ratio of pump speed to frequency is about 0.6) while duty cycle affects the pump’s power. These readings were taken while revving the engine in park, in a no-load condition. Under load, the changes would be a little more dramatic, but not a whole lot: the system is very accurately controlled.
Diagnosing newer smart power and PWM circuits most definitely require a slightly deeper understanding of the operating theory behind pulse width modulation, how to measure the duty cycle, current and voltage properties of these circuits. It is our hope that this article helps you to test these systems with more confidence!
Download PDF

0 Comments