
We’ve all seen it many times: The customer complains that the battery has died. Your job is to figure out why, so after replacing the battery your customer doesn’t come back with the same complaint.
As always, we start by asking the customer for some details: when did this first happen, did you leave something on, has the engine been cranking slowly lately, and so on. Then, we check the battery: How long ago was it installed, does it test good, are the terminals or cables corroded? Lastly, if all else doesn’t turn up an obvious cause, is to more carefully diagnose the vehicle and find the actual reason for the problem, and fix that, too.
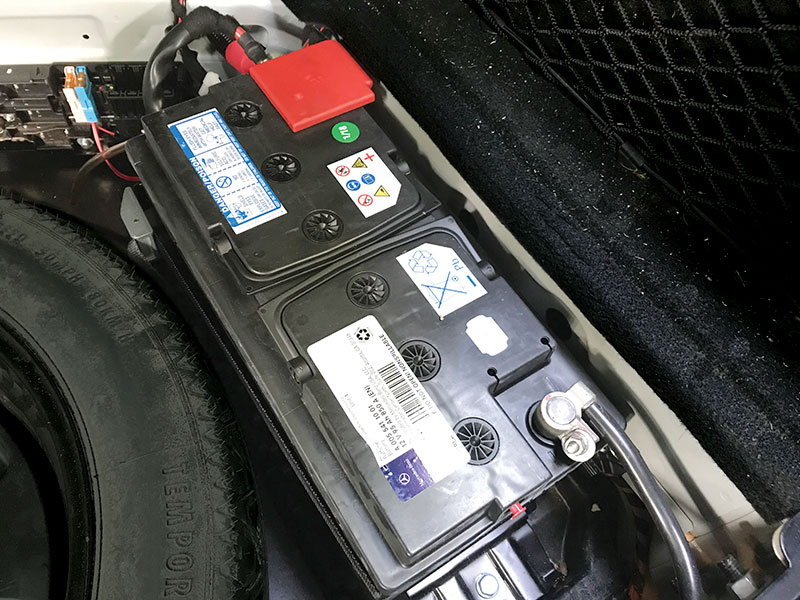
So let’s assume that the customer hasn’t noticed a problem and swears they didn’t leave their lights on. Uncover the battery and have a look. Are the terminals clean or is there some corrosion? It can’t hurt to clean the terminals anyway, either with some sandpaper or a battery brush. Of course, you already know to disconnect the negative terminal first, since having a wrench on the positive terminal and touching ground with it will absolutely ruin your day. While the terminals are disconnected, get out your battery tester.
While we haven’t see a Sun VAT-40 in several years, some workshops continue to use a carbon-pile load tester. We load the battery to three times the Amp-hour rating – that would be 300 Amps for a big 100 Ah Mercedes-Benz battery – and check the battery voltage after exactly 15 seconds. A good battery will read over 10.0 volts. While not exactly a bad choice, load testing like this isn’t nearly as accurate at showing the battery condition as a modern internal resistance tester.
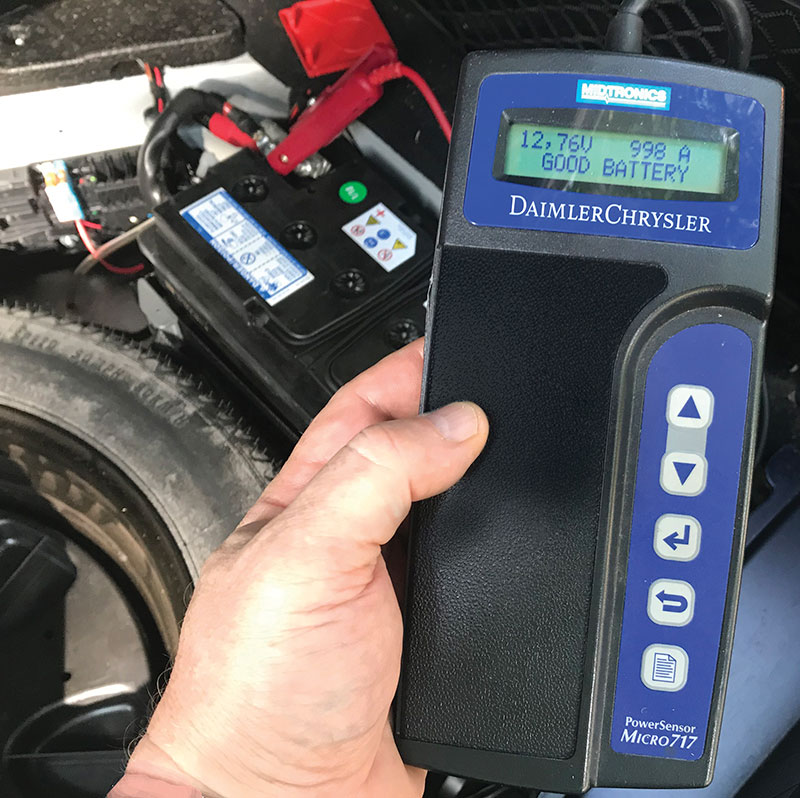
Mercedes-Benz recommends the Midtronics
165-EXP-717 tester and requires it for all dealerships. This tester uses “dynamic conductance battery testing technology,†which means it accurately measures the battery’s internal resistance to determine its condition. The advantage of this kind of testing is that we don’t need to apply a large load – which can be dangerous – and the tester delivers the results in clear, plain language: Good battery, Replace battery, or Charge and Re-test. For dealers, it also delivers a test results code, required for warranty claims. We’ve found this tester, and its immediate predecessor the Micro-717, for sale on the used market at reasonable prices.
A healthy lead-acid starting battery has an internal resistance of just a few milliOhms, or thousandths of an Ohm. Let’s say that the battery needs to be able to deliver perhaps 700 Amps for starting. If the internal battery resistance is too high, Ohm’s Law dictates that the voltage at the battery terminals will drop too much and not be able to run the starter. If the battery has an internal resistance is just 10 milliOhms, the internal voltage drop at 700 Amps will be 7 volts, meaning it won’t start the engine with only about 6 volts at the terminal. In contrast, a healthy battery would be expected to have an internal resistance of
3 to 4 milliOhms.
While we’re on the topic of milliOhms, if the electrical path between the battery and starter (and back!) has more than a few milliOhms of resistance, you’ll still end up with a no-start condition. It doesn’t matter where the excessive resistance is (and as odd as it may sound to describe 0.01 Ohms as “excessiveâ€), the result is still a no-start. What this means is that no matter how the battery tests, you need to check the condition of the entire current path from battery to starter and back.
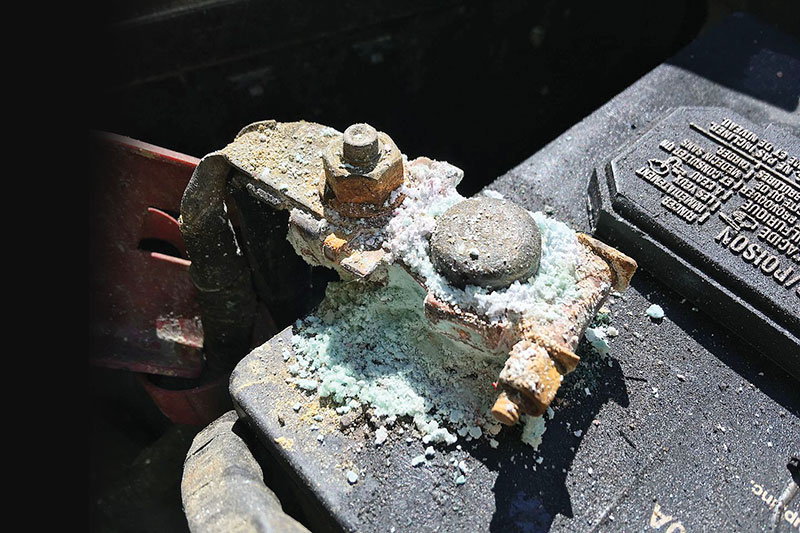
You’re looking for corrosion and loose connections, anything that might increase resistance by even just a few thousandths of an Ohm. Be sure to verify that the bolt holding the other end of the battery ground cable really is tight, and the ring terminal and the metal under it are clean and bright. If you haven’t cleaned the battery terminals yet, do that now. Don’t forget the positive current path as well: check it along the entire length, wiggling wires and terminals since a visual-only inspection might not spot trouble. All this should take just a few minutes.
OK, so the battery, after a recharge, tests good. The current path to the starter is fine. Why’d the battery go dead? In newer Mercedes-Benz models, the Battery Control Module keeps track of charge and discharge current and can offer you some clues. In our shop we consider the real introduction of this diagnosis aid to be with the start of production of the Model 164 M-Class and GL-Class models, although some earlier models had a more rudimentary system. It was installed on all models that were newly introduced starting in Model Year 2006, and later.
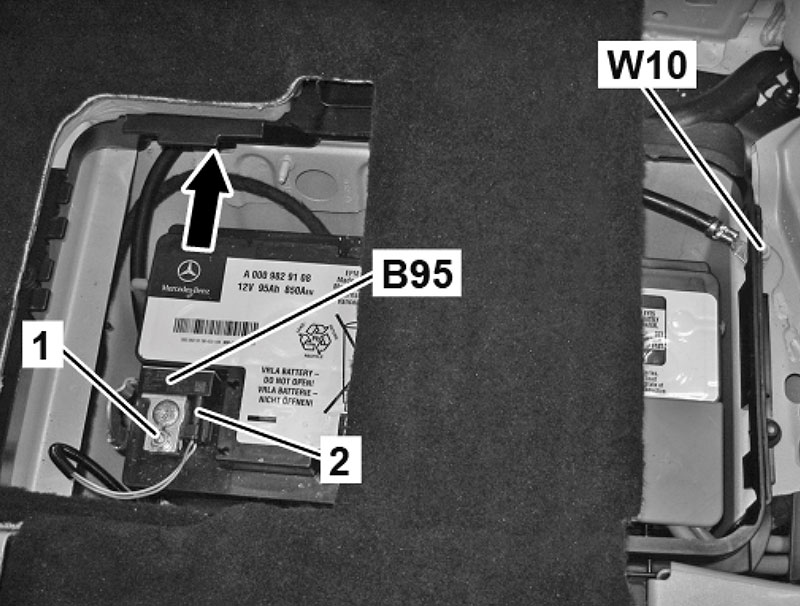
You can tell if your vehicle has such a system by looking at the negative battery terminal: Is there a battery current sensor? If so, most likely your vehicle is equipped. Here, we will be using the Model 166 (newer M/GL-class, also known as GLE and GLS models) system as our guide, but be aware that virtually all of these systems are quite similar, although there have been some improvements over the years.
Before we get into the details of the system, just a note that we won’t be discussing how to isolate excessive parasitic draws here. That was covered in the December 2015 issue of StarTuned.
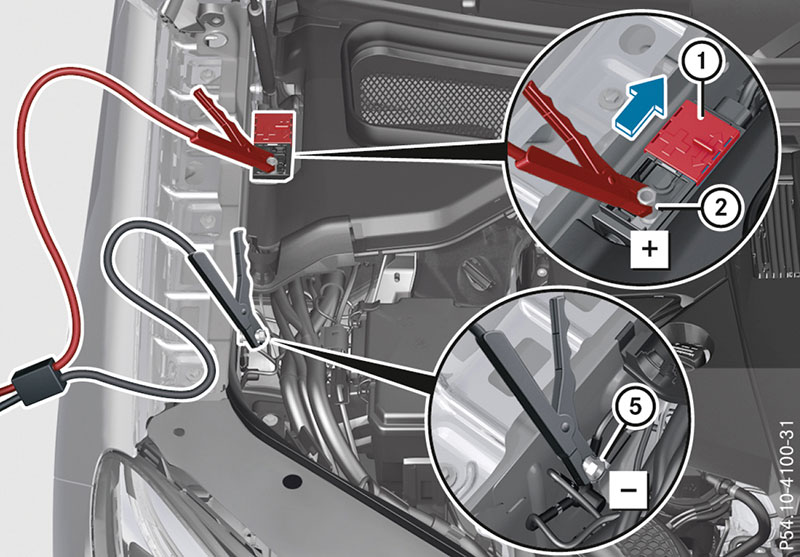
One thing about battery charging: If you recharge the battery by connecting directly to the battery negative terminal, the battery sensor won’t be able to ‘see’ it. You are better off connecting to the other end of the battery ground cable if possible or at least on the non-battery side of the battery sensor. Mercedes-Benz recommends using the jump-start terminals found in the engine compartment for all battery charging, specifically so the battery sensor can do its job.
The battery sensor has a bigger role in the vehicle’s energy management system than monitoring battery current draws. The energy management system takes care of the supply and consumption of electrical energy, with a primary goal of ensuring the vehicle can be re-started, along with the goal of ensuring a stable energy supply to all vehicle consumers. This system is made up of several components: The main vehicle battery, the battery sensor, the alternator, the engine control module and the Additional battery. The Additional battery in most vehicles is installed to ensure the shift-by-wire function can always operate, and in vehicles equipped with ECO Start/Stop it also provides the power to run the electrical system for a few seconds as the engine is being restarted (avoiding a ‘brown-out’).
The entire system is operated by the Signal Acquisition Module (or SAM), known as N10 in Model 166, with two basic functions: The electrical energy balance system, and the engine coordinator which can slightly modify engine running characteristics to support the electrical system.
The electrical energy balance system monitors the vehicle’s power supply and can actively intervene when necessary, for example by increasing alternator output and/or shutting off certain electrical consumers. So if the electrical system voltage is starting to sag, and the alternator is already giving all it can, and the engine idle speed is already increased, the system can shut off non-essential consumers like the heated seats to help ensure the rest of the system can continue to function.
The system’s most powerful tool is Alternator management. After the battery is discharged by the act of starting the engine, the energy management system starts out by commanding – via LIN-Bus communication – the alternator to deliver maximum output, also known as Fast Charging. As the battery recovers, the alternator is then switched over to temperature-based charging, which is the most common condition, found during nearly all operating conditions.
The system tells the alternator to reduce charging output (as long as the battery does not need fast charging) during high engine demand, such as during acceleration. This saves a bit on fuel consumption at virtually no cost. Similarly, when the engine is coasting such as a long downhill run, the alternator is asked to boost energy delivery, not only adding to the engine’s braking effect but recovering the downhill kinetic energy as electricity for the battery.
Certainly this doesn’t count as regenerative braking, but it is just one example of how far modern automotive engineering has gone in pursuit of ever-increasing fuel economy. It also points to some new thinking needed when diagnosing something as simple and well-understood as an alternator. Now that the alternator has gotten ‘smart’ and can communicate with a control unit, technicians have to keep that all in mind as they try to figure out why their customer’s vehicle is acting strangely.
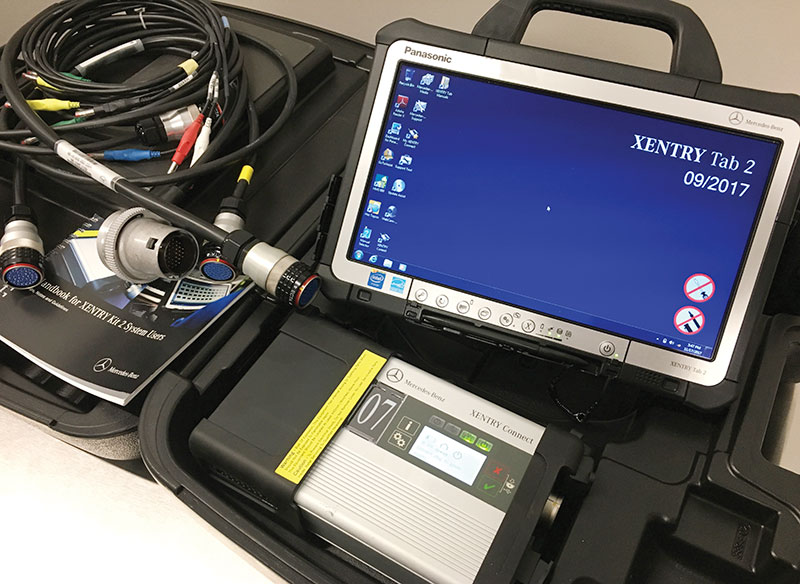
This also makes a case for taking advantage of the highly-advanced diagnostics available in Mercedes-Benz vehicles by getting and using a modern XENTRY Diagnostics System. It certainly is a considerable investment for any small business to get a XENTRY machine, but you need to do the math: How much will this machine cost, and how much will it make? Just like any tool – think of a vehicle lift, air compressor or tire machine – it is an investment in your business and your ability to serve your customers efficiently.
Back to the energy management system: As a side job, it also collects data on the vehicle electrical system and makes it available to us for diagnosis. It also will flag what it calls a “conspicuous†problem, which is anything that the designers thought might be something you should look at. Brings a whole new meaning to the term Conspicuous Consumption.
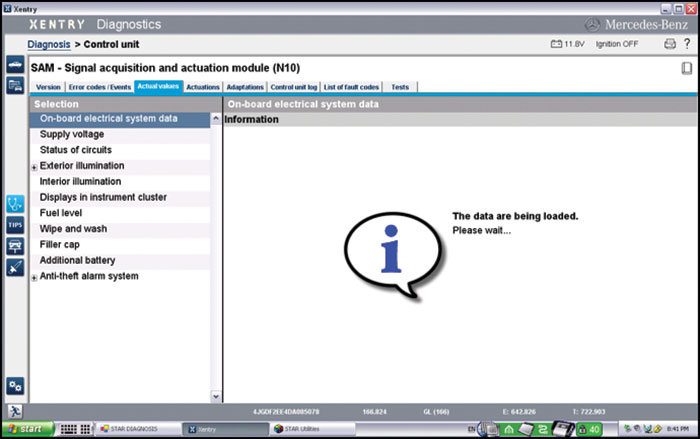
To get in to the battery monitoring system, start up your XENTRY Diagnostic System and navigate to the SAM control unit. In models having both a Front and Rear SAM, it will usually be the one closest to the main vehicle battery, but of course if it isn’t, just try the other one. On the Actual Values tab, select the entry for On-board electrical system data. Give the system a moment to gather the data and format it for display, and the overview screen appears.
On the overview screen, we can see the last 100 “engine off†and “driving†cycles, and how much electrical energy each particular cycle added to or removed from the main vehicle battery. Note that cycle 1 is the newest cycle, and the older cycles have higher numbers.
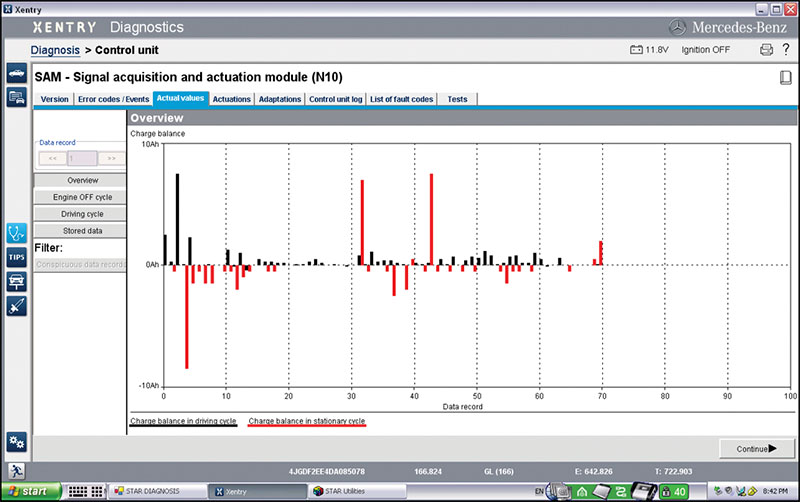
Take a look a Figure A: The black lines show the number of Amp-hours added to or removed from the battery during a driving cycle, and the red lines show the same for a ‘stationary’ (engine-off) cycle. In the image, you can see that some driving cycles show a negative charge balance, meaning energy was lost, and some stationary cycles show that energy was gained, meaning a battery charger was connected.
Note that a driving cycle begins when the engine is started, but the data for that cycle is not recorded until the engine is switched off. In the same way, a stationary cycle begins when the engine is switched off, but the data is not recorded until the engine is started again. You need to keep that in mind when counting backwards to identify a specific cycle.
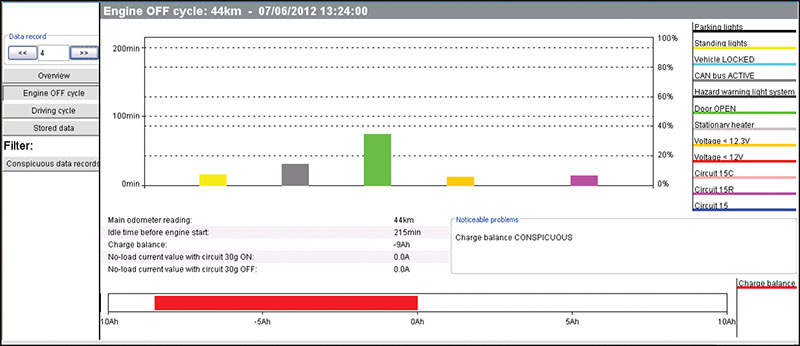
Now take a look at Figure B, which in this example shows the specific details of engine off cycle #4 (see the top left of the image – clicking the arrow buttons goes to the next or previous cycle). You should compare this to cycle 4 in Figure A: it is the longest red line, dropping downwards. This detail screen shows several things: The battery lost 9 Amp-hours (red bar at bottom), a door was open for about 70 minutes (green bar), the standing (parking) lights were on for about 15 minutes, the CAN Bus was active for about 30 minutes, the battery voltage fell below 12.3 volts for about 10 minutes, and Circuit 15R was on for about 15 minutes. No wonder some energy was lost!
We can see that the odometer reading was 44 km (convert to miles for USA vehicles by multiplying by 0.62) and the vehicle was switched off for 215 minutes before the engine was started again. You can also see the system noting that the charge balance (here, – 9 Ah) is “conspicuous.†Using this information, for whichever cycle you wish to examine, can help you figure out what was going on while the vehicle was parked. Finally, note the time and date stamp at the top of the graph: This comes from the COMAND head unit via GPS, so it can be wildly inaccurate if GPS or COMAND isn’t functioning.
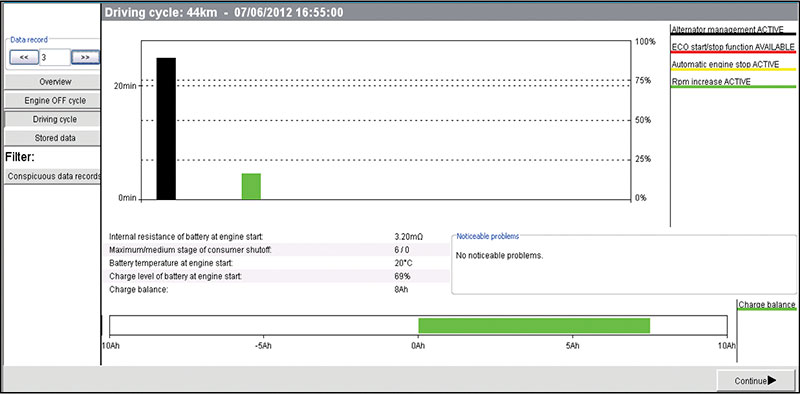
Figure C shows the next screen, the driving cycle. This is a chart like the engine off cycle, but here we see nothing unusual, and we can see that the battery gained about 8 Amp-hours. The battery was only 69% charged when the engine was started, with a measured internal battery resistance of 3.20 milliOhms. We would expect a state of charge between 70% and 100%, so this is a bit low. We can see that alternator management was active for most of the trip, and engine RPM increase was active for a short while, likely because the system was trying to recharge the battery. In a drive cycle like this, your customer might complain that ECO Start/Stop was not activating, and you can explain that the battery was a bit low at engine start. This example shows how this data might help you explain the vehicle’s symptoms to your customer, which would be impossible without it. Note that data is not recorded for driving cycles of less than a minute.
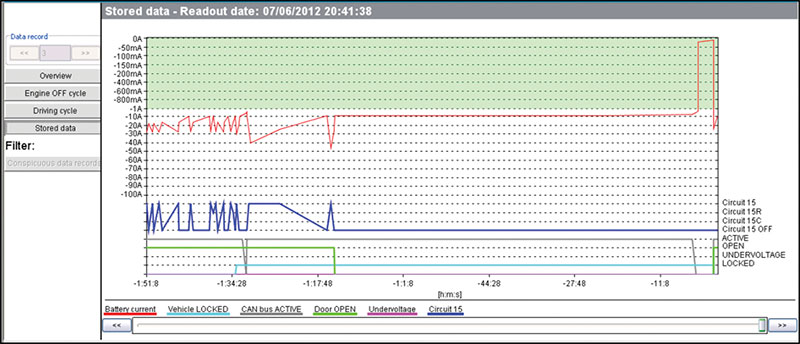
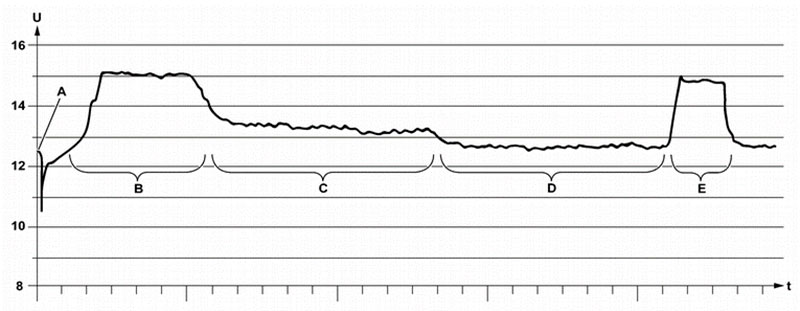
The last screen is the Stored Data screen. Here was can see, as a line graph over a long time, what was going on with the vehicle. The graph shows a variable period of time from as little as 30 minutes to as long as five days. The system is constantly storing data, and stores a data point at least every 17 minutes, but if things of interest are happening, it will store data points more frequently. This means that if a large number of changes are recorded, the time period available for display will be shorter, and if only a few changes are recorded the time displayed is longer.
Some important points to note for this graph:
- A sloped line does NOT represent a slow transition between states. The graph software is merely connecting each measurement point with a straight line. So that gradual change in Circuit 15 between about -1:20 and -1:15 just means there are only two data points, one ‘on’ and the other ‘off’ at those times – the in-between is unknown.
- By using the slider at the bottom, different periods can be viewed. The time scale automatically adjusts to show data of interest.
So the next time your customer comes in with a dead battery, you can look like a wizard when you show them that they’d left their lights on last night – as long as they ended the Engine-off cycle by starting the engine…|


0 Comments