
The Q3 and Tiguan share many components and controllers. This article discusses the correct sequence to measure a possible parasitic draw. Both of these models do not have a draw of any kind. The interest is network activity and the length of time sleep mode is active. This article also mentions “cold to hot†tests.
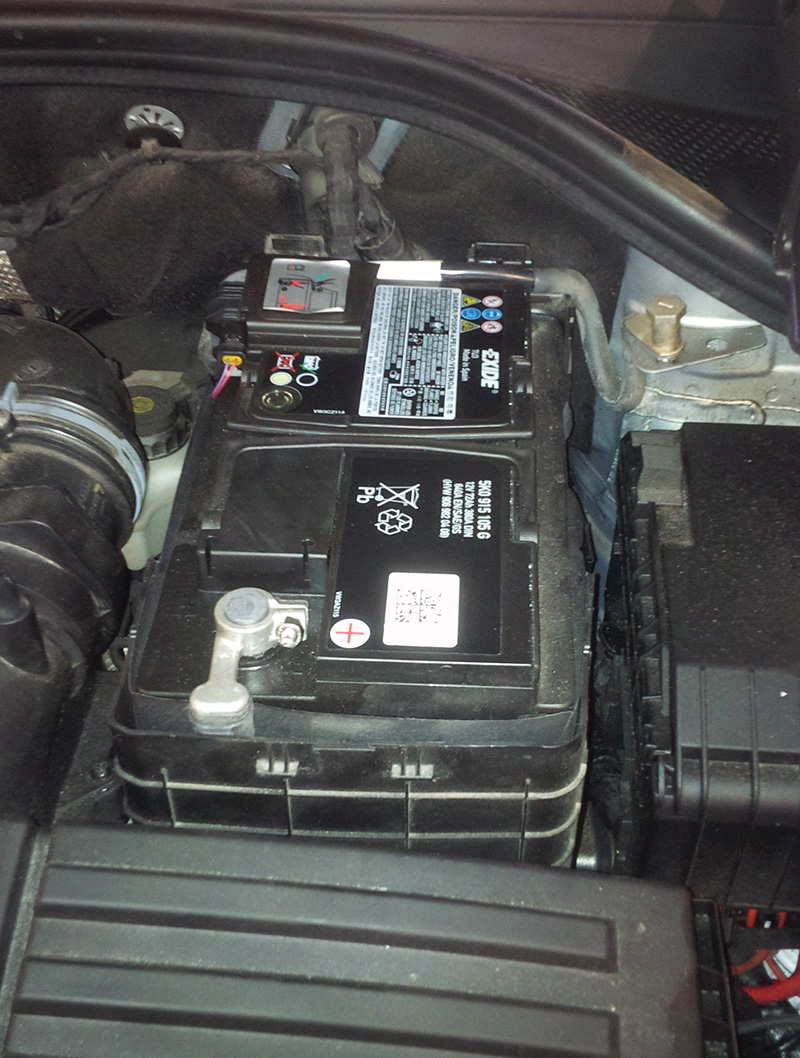
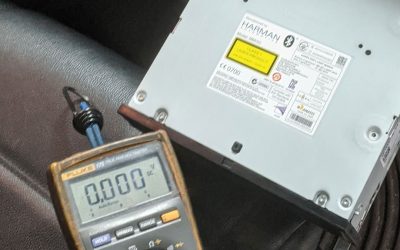
With both the Q3 and Tiguan, the battery and electrical center are orientated identically. View the negative post and ground cable, this will be the test point and, fortunately, only one ground cable is attached between the battery negative and body ground.
The Path of Least Resistance
Electrical energy will always take low resistance paths and will include the one with least resistance. Electrical energy will also take every other path available to it.
This experiment with both the Q3 and Tiguan is meant to test any parasites and graph the time that sleep mode is commanded. There is a difference, however, between the length of time sleep mode was activated and the engine temperature relationship.
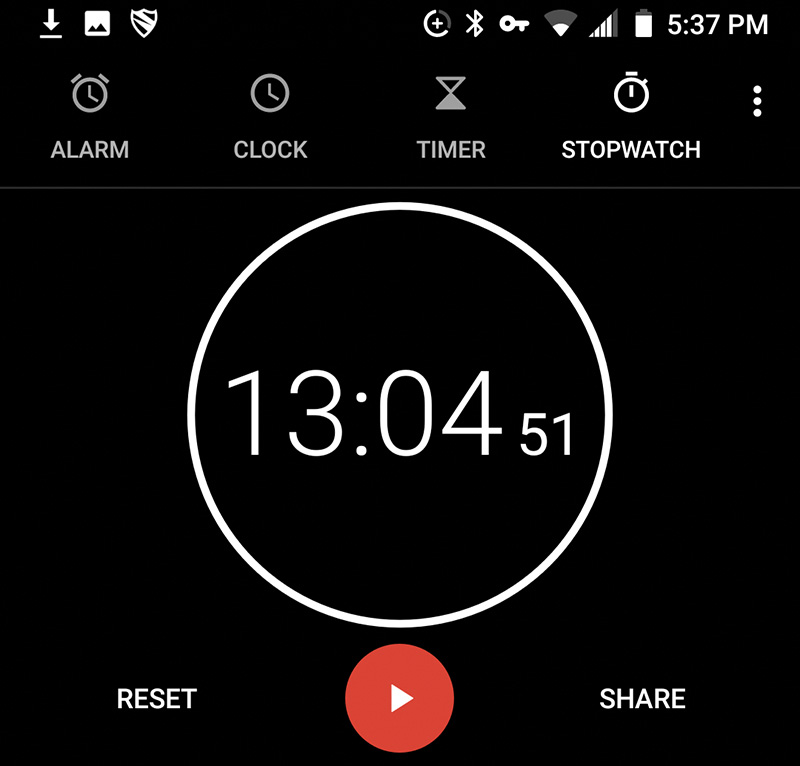
The first test was with a cold and already in sleep mode Tiguan. This test lasted for under 13 minutes.
The recording with the Android device with a Bluetooth meter offered a graph when the vehicle was in sleep mode and the driver’s door was opened and closed. The hood was opened and key was not inserted into the ignition switch. Total test time is 722 seconds.
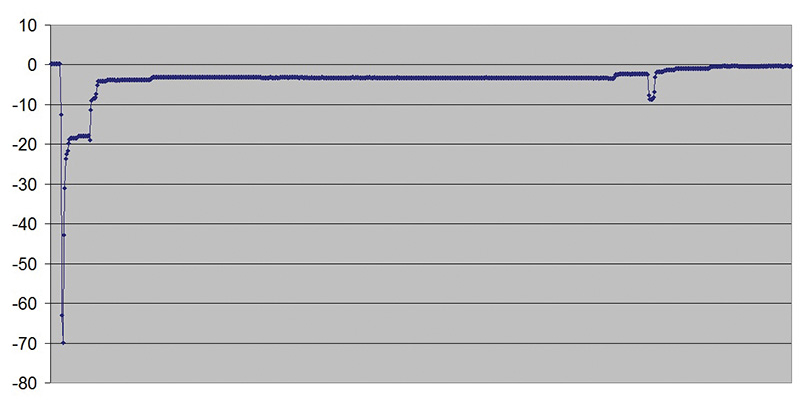
This type of test equipment comes with the load measured every second and the meter set to record for 20 minutes. The XML file that has been recorded resides within the Android or iOS device. Transferring the file and using MS Excel, the identical image is graphed. All of the data required to create the graph has columns that indicate the number in; seconds, date, time, measurement type, unit, and value. Accessing the data, total parasite with the timed test is about 715 seconds. Time in minutes calculates to 11.92 minutes. Graphed from the Excel file offers this total image.
Is there more data to look at?
With Excel, data of interest can be “zoomed†in to graph the first part of the test and any other interesting points on the graph (see First cold test). The next graph was created with the first 60 seconds. Each dot in the graph is a one second data point.
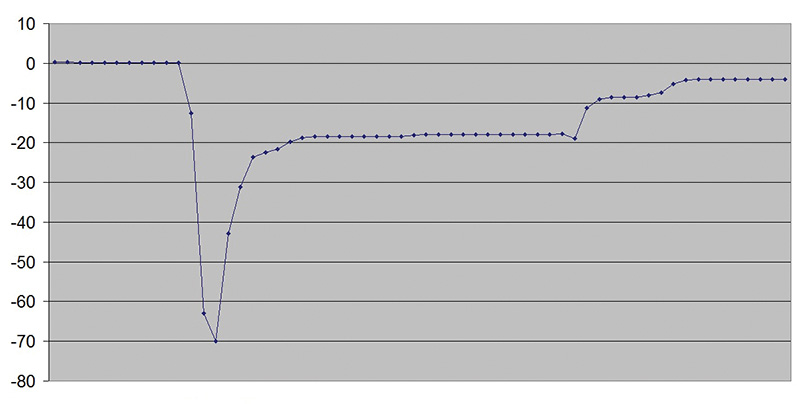
Let’s break this graph into time versus current
The image named First test for 60 seconds was created with Excel and, noticeably, the first drop or current draw measured is: a) open and close the driver’s door; b) the network becomes active; c) the fuel pump control module is active and the highest recording was -69.9 amps.
The pump remains alive for about 10 to 12 seconds. Count the dots at the moment of the current draw until the current draw levels.
With the first image and close to the end of the test, there is one more current draw that spiked. That was when the network was commanded to sleep mode.
The final command of this test lasted 75 seconds using the recorded data.
If the images displayed are looked at as “one†test and graphing each interesting current spike as a completed test, then this specific test can be considered normal with models like the Q3 and Tiguan. The model was cold, was not running since the day before, and never had a parasitic draw.
The next test should be as interesting, and there is one known fact about the TFSI (Turbo Fuel Stratified Injection) engines. This has been mentioned a few times within this series of articles. The TFSI engine that has been running for some time and at normal running temperature will take longer to enter sleep mode.
The reasoning is that the engine management system will keep the fuel pump operating to lessen the chances of a vapor lock (hot soak condition) in the fuel system.
Think about this for a moment — the vehicle does start in the morning, but somehow the battery suffered a substantial current draw over time and it didn’t regenerate/recover.
Make sure the service battery is tested when in doubt.
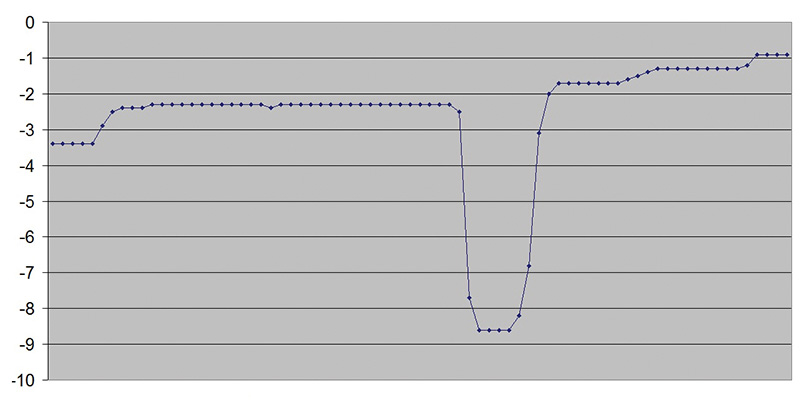
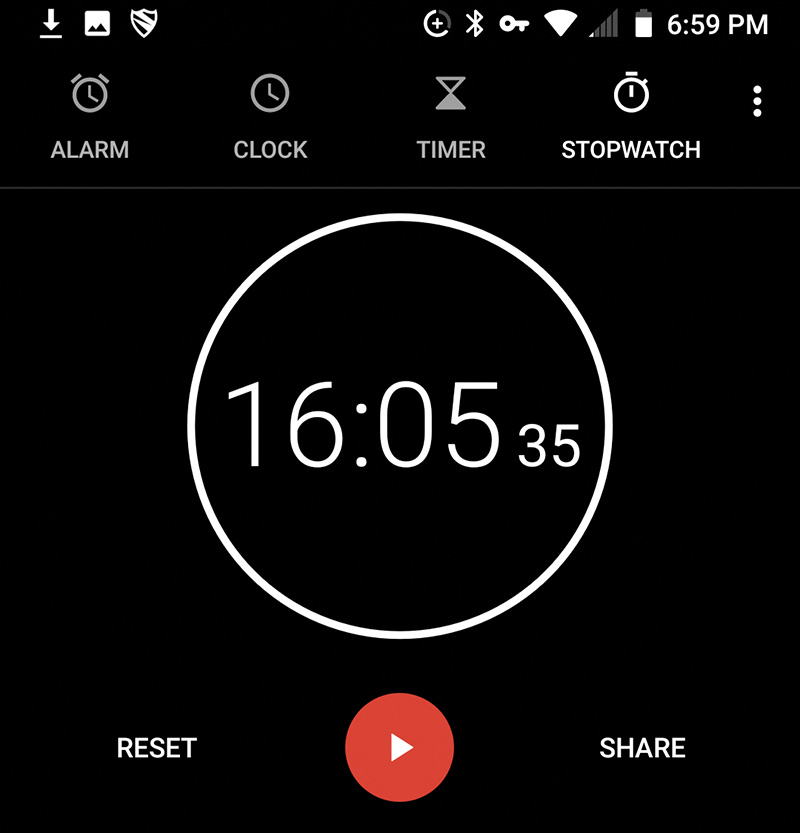
Let’s look at a hot engine, road tested for 20 minutes and up to normal temperature. The image was captured while the engine was running for a few seconds, hood opened, engine turned off, and we waited until the vehicle was asleep. Total time was about 16 minutes.
The timed test with the hot running vehicle can be examined like the first, cold, non started Q3 and Tiguan. Note their similarities from the first three parts of this series of articles, the major difference being the Q3 having more “bells and whistles.â€
The graph indicates one digit of interest: 19.4 amp positive, meaning the engine was at idle. The next increase in current has an interesting set of spikes.
The greatest current draw is -46.3 amps with another spike near the end of the test.
More data over time
Again with the XML files captured within the Android or iOS device, data can be transferred to a laptop (preferred) or used within a tablet running Excel if that software is capable to import the XML file. The last step and last test can be explained in a timed sequence.
- At idle, the alternator is charging its peak at plus 19.4 amps.
- With the driver’s door open, the ignition is turned off and door closed.
- The minus -46.3 current draw is the engine management system active.
- As the networks begin to shut down, the fuel pump module is still active.
- There is one more spike similar to the first “cold†test with a waiting period.
- At the end of the waiting period, there is a dramatic release of current consumption.
- The last few moments indicate sleep mode is active.
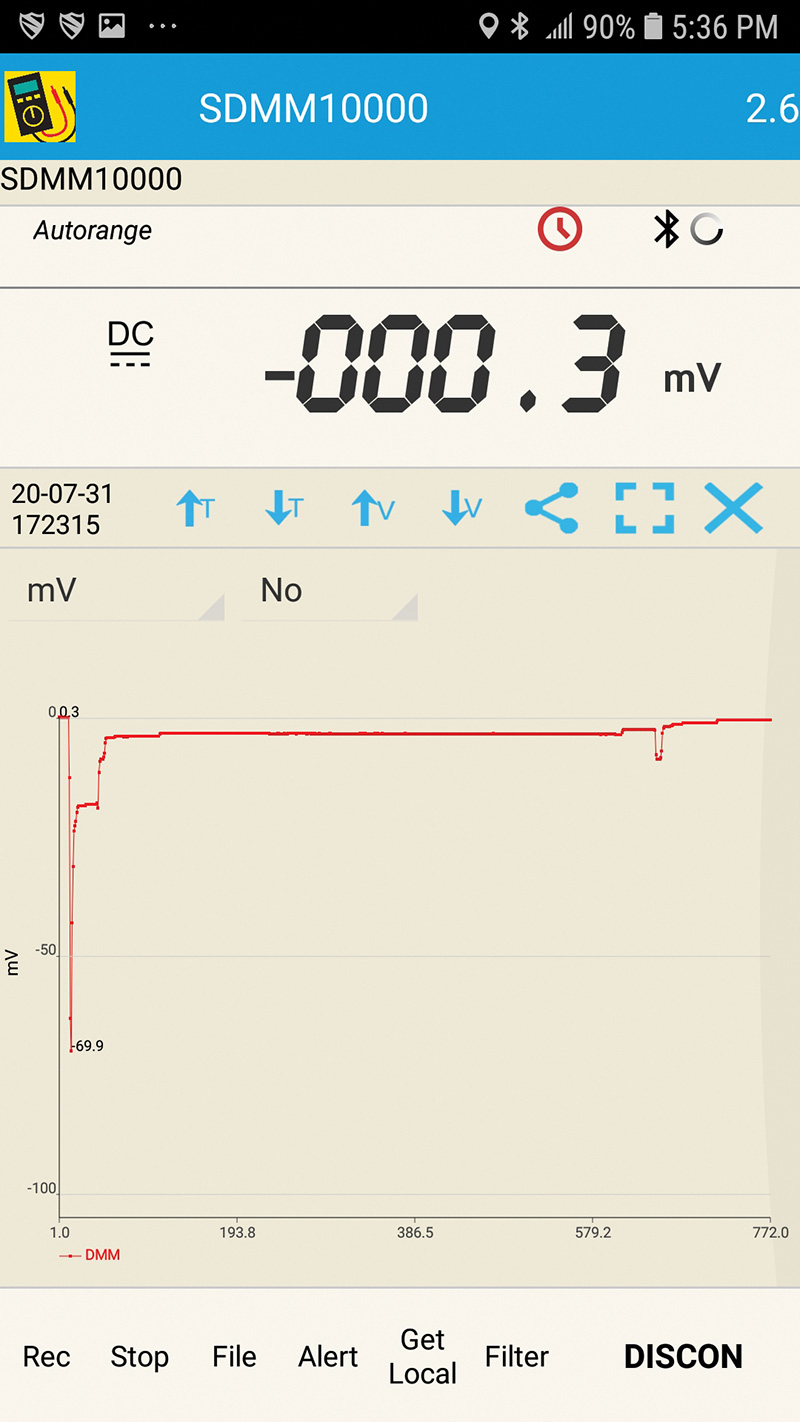
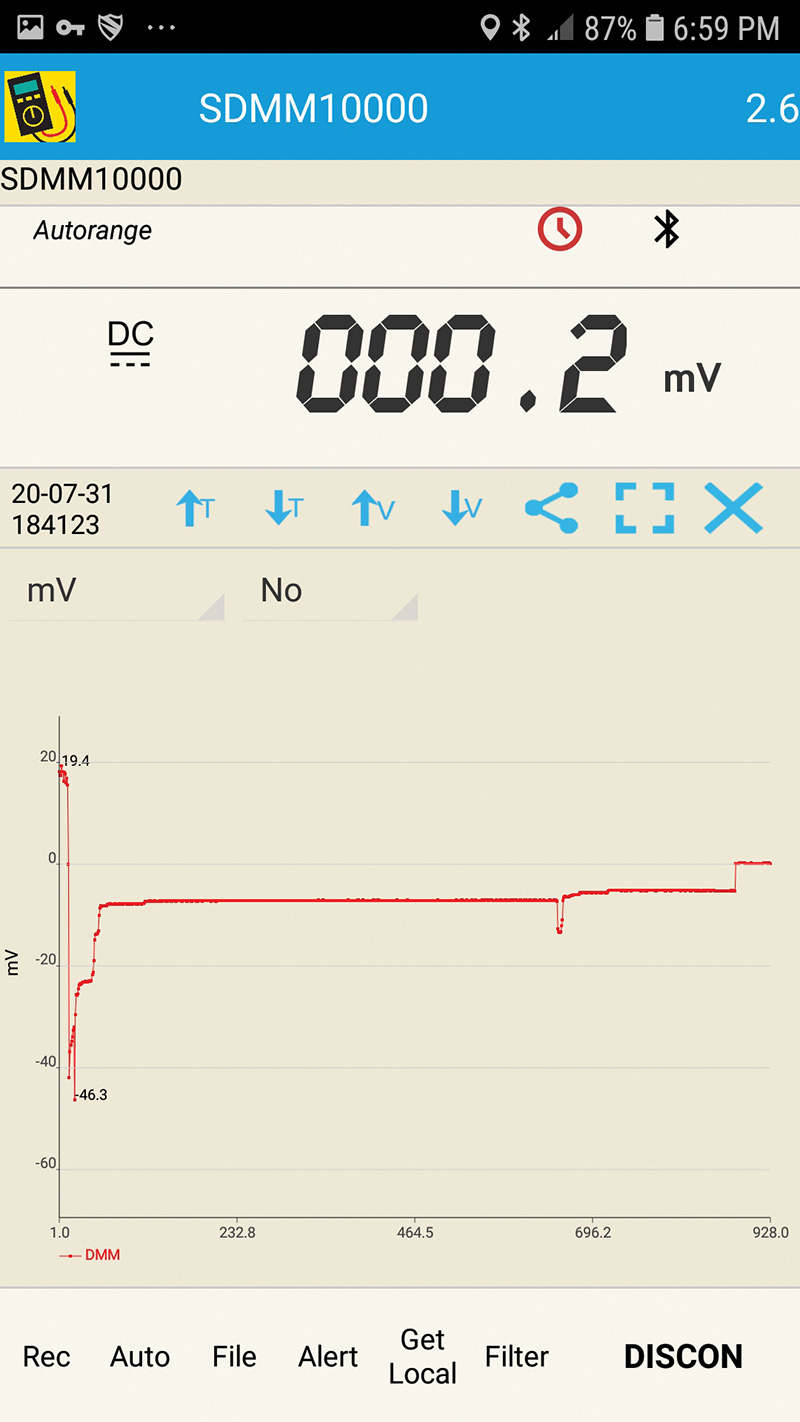
The data on the screen
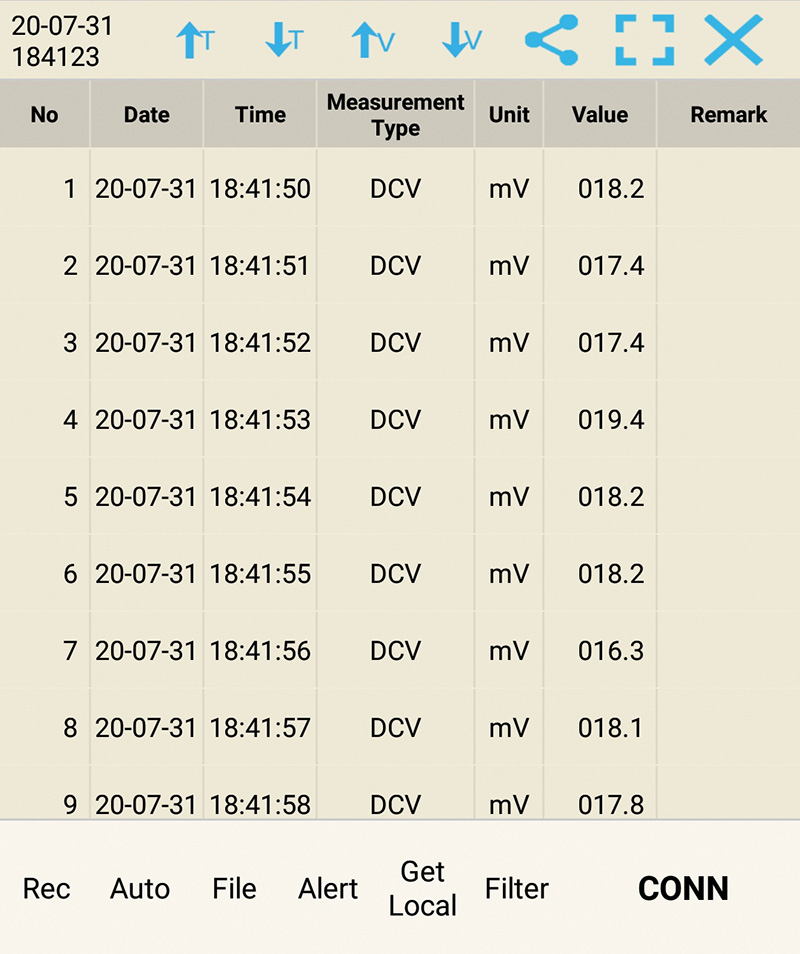
As mentioned earlier, swiping the screen offers another view of the data the Android or iOS is recording. The image shows the first 9 seconds when the recording began. This display is the XML file stored within the device. Read line number 4 on the image and match the graph in the previous image.
Note to self!
On the very first test and calibrating the amp clamp, it seemed that direct sunlight was affecting the meter readings over time — not by much, just enough to be annoying. Ensure test equipment is not in direct sunlight for extended periods of time. Calculations and data can differ slightly, so be aware of the annoyance.
What is being calculated?
What is the difference between the time recordings compared to cold (ambient) and hot (road test for 20 minutes)?
The most accurate calculation for time is from the XML file during each test. The average between these two tests is about 4 minutes. Be aware, the final in-shop test was accomplished with an open hood and in the building. Expect the hot soak condition with a closed hood and in direct sunlight to last longer.
What was learned?
The fuel pump control module is active when opening the driver’s door.
Engine management monitors the coolant and fuel temperatures when the network is active. In this case, network activity was awake with one door opened and in a cold state.
With a hot engine (coolant and fuel temperature), this condition keeps part of the engine management system active to prevent fuel line vapor locks (hot soak).
Two more items to consider with hot conditions, one being the cooling fan and another is the coolant recirculation pump that is also monitored with the engine management system. With both the cooling fan and recirculation pump operating, expect a much high current draw.
This set of tests was carried out to solve a theory, but parasitic testing should always be tested indoors, with the vehicle at ambient (room) temperature, and prepared in a manner that allows access to the interior of the vehicle.
Multiple tests were also carried out with different scenarios, such as the hood open or leaving the key in the ignition. Multiple vehicle tests provided some proof that, despite the hood or key in the ignition, the vehicle still entered sleep mode with the doors and trunk/gate closed. It may have taken a little longer, but sleep mode was activated.
A series of monitored tests did offer interesting results when the amp clamp was still attached to the negative side and the key slipped out of the ignition. The noticeable spike was evident but, soon after, the network entered sleep mode. Closing the hood offered the same result.
It can be argued but none of those scenarios offered any battery draw except for one type of key. The proximity key can be an absolute annoyance. If that style of key is close to the vehicle and accidentally touching the door handle sensors, you’ll have to start all over again!
For the younger and learning technicians, listen up. Just wait until you have a complaining IP addressed controller and it wants to “talk all day long.â€
Stay tuned, more reading and tests to work on will follow.
Remember to protect the customer’s privacy and all recorded information.

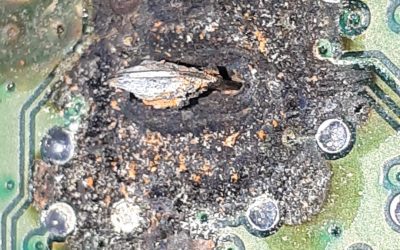
Common problem after 2014 cars is the Haldex controller on the side of the rear diff. They have both a permanent 12v and ignition supply. When they corroded inside due to salt/water ingress, part of the PCB corrodes that controls the standby/sleep function so it stays awake permanently.