By John Anello
I was called in to a shop for a no-start complaint on a 1997 Ford E250 (Figure 1) that recently had its 4.2L engine rebuilt. This vehicle was strictly for commercial use, and it had about 317,000 highway miles on it. The owner of the van told the garage that it ran fine after the engine was rebuilt a few months ago. He had been on the highway when he experienced a loss of power, then it suddenly stalled out. He tried to get the vehicle off of the highway, but it would barely run, had no power and when he gave it gas it just simply cut out. So, he had to have it towed.
No DTCs, No Backpressure, Plenty of Voltage
The shop replaced the spark plugs and wires and got the van to run, but it was missing badly and they could barely keep it running. Then, it suddenly died and went into a hard-start/no-start mode. The techs checked for trouble codes, but there were no DTCs stored in memory. They performed a back-pressure check on the exhaust to find out if the exhaust system was restricted, but the results were negative. The ignition coil’s output was then tested at the end of the spark plug wires. The voltage was adequate to fire the compressed mixture, but the plugs kept getting fuel fouled after an extended period of cranking. Even though the engine had recently been rebuilt, the compression was tested anyway, and it was acceptable. At this point the shop decided to call me in to get a second opinion.
A Gas Analyzer for a No-Start?
When I arrived, the van was still in a no-start condition, so I decided to try out a new no-start check technique I have been performing over the last few months using my ATS emissions analyzer in a graphing mode. Taking gas readings while the engine is cranked for at least 15 seconds allows the analyzer to record the current tailpipe gas levels. These cranking gas levels are not what you would normally see with the engine running. I have always used a gas analyzer with the engine running, and never gave any thought to trying it on a no-start or hard-start condition. This idea came from Bernie Thompson at ATS, and I needed to see for myself whether this type of test held any value for my diagnostic approach — I’m always eager to learn new test procedures to speed up my diagnostics and take me to the next level. I’m never happy with staying in one place, and this is what gives me the drive to better myself as a technician by keeping on the cutting edge.
Accumulated Data
Using a five-gas analyzer in this fashion requires a lot of accumulated no-start vehicle test data. This is something you can’t learn overnight, but rather over time. The gas results will give you a sense of where to go in your diagnosis of a no-start situation with just 15 seconds of cranking. The most common no-starts in my experience have always been no spark, no fuel, valve timing, ignition timing, or clogged exhaust. The analyzer will help you build relationships in the gas patterns expected with each type of no-start encounter. The analyzer itself must have an interface with PC graphing software that can display HC to as high as 30,000 PPM. The front panel of an analyzer just won’t do because it’s limited to 9,999 PPM. Any reading above that will only show OL.
I warmed up my analyzer, stuck the probe in the tailpipe, and instructed the technician at the shop to crank the engine. Keep in mind that the emissions software has an auto range feature, so you need to pay close attention to scaling values at the left side of the graph. While the tech cranked the engine, I watched as the gases were graphing (Figure 2). I saw the HC rise to almost 23,000 PPM and this quickly indicated to me that the engine was getting sufficient fuel — the fuel pump and injectors were doing their job. I also noted that CO rose to 3.19 %, O2 fell from 21% to 13.89%, and CO2 rose to 1.39%, indicating that combustion was taking place in the cylinders. This engine had to be getting good spark or there would never have been any CO or CO2 being created. Notice also that the HC and CO rose at the same time indicating a controlled fuel delivery. Had there been a sudden rise in HC well before CO was created this would have indicated an uncontrolled fuel delivery such as a leaky injector or fuel regulator dumping raw fuel into the engine prior to an injector command.
Looks Like Timing
I have been using this no start gas analysis on many vehicles and it hasn’t let me down. The key issue on this vehicle was the CO2 level at 1.39%, which indicated inefficient combustion on a cranking engine. This compared with my HC and CO readings usually means the engine is out of time, or that there’s a clogged exhaust. I had the same emissions gas scenario on a ‘96 Chevy Caprice with a 5.7L engine with an ignition rotor that had worked loose and partially spun on the distributor shaft.
If the van was lacking in fuel, I would’ve seen a low HC and CO output and a sudden drop-off of CO indicating a lack of continued combustion. Such was the case on a 2000 Chevy Express 5.7L (Figure 3) that had a bad fuel pump that delivered only 43 pounds of fuel pressure compared to the 57 pounds it should have put out. If this vehicle had lacked spark, there would have been a sudden rise in HC to well over 14,000 PPM, but with almost no CO or CO2 present. That was the case on a 1996 Honda Civic 1.6L (Figure 4) that had a bad ignition coil.
Further Evidence
Back to the 1997 Ford E250, the engine had just been rebuilt, so how could it have jumped time? The garage tech was in a state of disbelief of my new test procedure, and was just not sold on my findings. He was not eager to pull the timing cover to test my new theory, so I had to go a step further just to show him that the proof was in the emissions pudding. I hooked up my eight-Trace EScope by connecting to the cam sensor, crank sensor and three ignition coil drivers (Figure 5). The ignition coils were being triggered as the engine cranked, and the crank and cam signals showed proper amplitude and frequency output. I had to check further for proper camshaft to crankshaft correlation of these sensors. I superimposed the cam and crank sensor signals and zoomed in on the rise of the cam signal line so I could get a better view of their relationship (Figure 6). I now needed a known-good waveform to compare the crankshaft synch pattern’s relationship to the cam signal rise. I normally save many cam and crank correlation files so I can latter compare them to problem vehicles. This keeps me from having to pull the timing cover just to prove a point. If you don’t have a known-good waveform saved for a particular vehicle, you can always search the iATN knowledge base, or even invest in a CD from Thompson Automotive Labs at HYPERLINK “https://www.acemisfire.com†www.acemisfire.com. This CD has most of the cam and crank waveform patterns for domestic cars and trucks.
Using the CD database, I pulled up the cam and crank reference file for this vehicle (Figure 7). I could now see the difference between the waveforms by looking at the location of the double notch synch signal within the crank sensor pattern. There are 36 notches (34 notches plus the double notch, which is the synch spot) on the crank pulley that the crank sensor reads, and each notch represents 10 degrees. The cam and crank were out by almost 13 notches or 130 degrees!
There was a good chance that something went wrong during the rebuild procedure. The compression on the engine was not bad, but I asked the tech to pull the engine cover so that we could dig a little deeper. I told the shop to call me once the cover was removed.
Surprise!
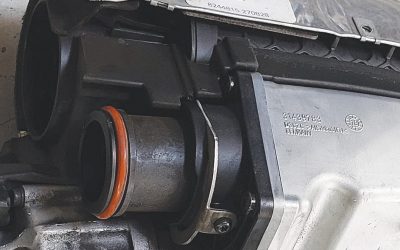
I got the call the next day. The technician at the shop told me to come over for the surprise of my career, and to bring a camera. I drove there about the middle of the day and came into the shop ready for a photo shoot. I could not believe what I saw! The crank pulley hub had snapped (Figure 8). The pulley had spun, and the nose was still keyed to the front of the crankshaft. Compare the new pulley to get a basic idea of how much of the nose broke off. The technician was in the middle of drilling out the broken part of the old pulley that was still stuck on the crankshaft (Figure 9), and he told me he would have it running later in the day.
The tech and shop owner were very happy with my services, and they could not thank me enough. At that point, we all shook hands, I collected my diagnostic fee and I was on my way.
Not So Fast
All day long I was telling the story to shops in my travels, and they couldn’t believe the outcome. This was probably not a good thing to do because somehow whenever you talk about a job, it comes back to haunt you. That’s just what happened. I got a call near the end of the day from the shop stating that the van’s engine runs now, but is missing and has no power, just like before. How could it be running as it had previously when the shop just repaired the obvious problem? In the tech’s mind, it was the same problem, but in my mind it was a similar problem. Similar means it feels the same, but really isn’t. I can’t get paid for the same problem, but I sure can get paid again for a similar problem. Now I had to go back for a third trip to wind up this diagnostic adventure.
Wire Mixup
I arrived at the shop again, and the van did start, but was missing badly as if it was running on only a few cylinders, and it lacked power. I did a quick power balance on the engine by disabling injectors one at a time. I found that cylinders #4, #5 and #6 were not working. I kept it simple by thinking outside of the box and checking over this shop’s work. Then it hit me! This tech had done what a lot of other techs have also done on this particular engine in the past. That is, install the ignition wires in the wrong order on the driver’s side. It’s common for this to happen if you’re not careful. If you look at the ignition coil-to-engine pattern (Figure 10), you can see that the coil towers on the passenger side are numbered 1, 2 and 3 from front to back in keeping with the order of the engine cylinder positions on the passenger side. On the driver side, however, the coil the towers are numbered 5, 6 and 4 front to back. As you can imagine, it’s a common error for a shop to connect the towers to the engine as 4, 5 and 6 front to back.
I did the good deed of relocating the plug wires back to their proper locations, and the van ran like a champ. As what I consider a good business practice, I didn’t charge for my time, but I alerted the techs to their mistake and just shook everyone’s hand again and wished them a good night.
My dilemma was finally over and I was able to sleep that night knowing I would not see that van again, and I was sure of repeat business from that shop.
Today’s cars are hard enough to fix, but when the original problem is compounded by the shop, or by other shops along the way, it just makes the diagnostic job that much more difficult. The key factors are to gather as much information as you can about what was done to the vehicle and what parts were changed. It’s not uncommon for a defective or damaged part to be installed, or for poor workmanship to have been performed to the vehicle. A troubleshooting manual may not always hold the answer to a problem, so keep an open mind and use your technical foundation of system strategies to approach
the diagnosis.
mr ayers could you possibly PDF file this article thanks mark ferraro
Hi Mark, The PDF is now available. We’ll update the HTML version soon. Thanks.