

The Mass Air Flow (MAF) sensor provides critical data to the ECM for calculating cylinder air charge and engine load. In combination with other sensor data inputs, the ECM determines a load factor, which is then used to calculate optimal spark advance and torque management to maintain the lowest overall emission levels.
Overview
Proper operation of a fuel injection control system is highly dependent on the ECM’s ability to properly deliver the right air/fuel ratio to each cylinder at all times. In order to do this, the ECM needs to know how much air is entering the cylinder at any given moment.
Traditionally, there are a few methods used to predict and/or measure the amount of air entering the cylinder. One involves the speed-density equation (Figure 1) utilizing the Manifold Absolute Pressure (MAP) sensor, and the other uses a mass air flow sensor. In some instances, you may see engines with both sensors being used, such as on the 2020 Altima with the 2.0 L turbo KR20DDET engine.
Mass Air Flow Sensor Operation
The mass air flow sensor does not actually measure 100% of the air entering the engine. The sensor is only sampling a small percentage of the air flow and extrapolating the mass of air charge entering the engine. The sensor is located in a specific position along the air intake tract designed to provide a stable air flow measurement environment.
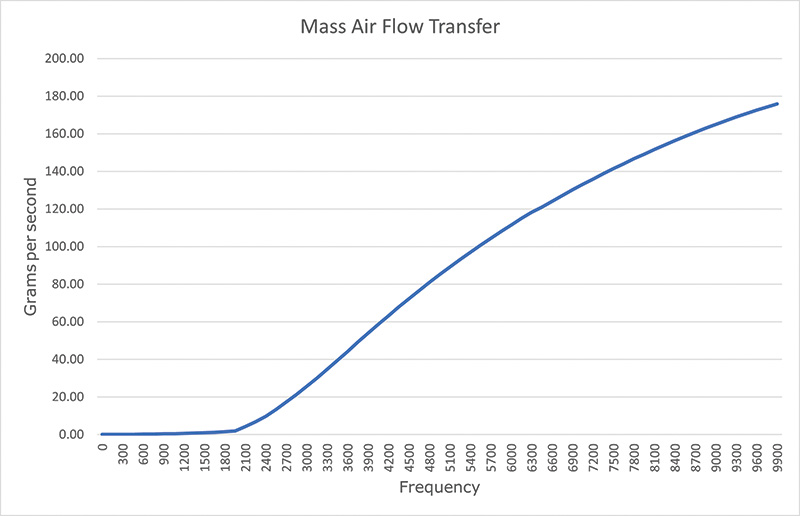
When the vehicle systems are engineered, a transform function (Figure 2) is created which plots out the sensor output signal and correlates it with a specific air flow rate, usually in grams per second. The way the sensor measures this air flow is usually done by routing the air flow across one or more hot wire anemometers. These sensors are electrically charged and heated to temperatures well above ambient.
When air flows over the sensor, it cools the wire, which lowers its resistance and allows more current to flow. This change in current is how the sensor’s output is correlated to the amount of air flowing into the engine. The air flow pathway (pictured in Figure 9) will also usually include a temperature sensor in order to provide the ECM with the air inlet temperature.
Manifold Absolute Pressure (MAP) Sensor
The MAP sensor is another critical input that the ECM uses to measure/predict cylinder air flow and helps to cross-check air flow values received by the MAF sensor used during diagnosis. Modern engine designs often include variable valve timing and intake manifold tuning valves and/or boosted components. These components are used to help optimize the cylinder air charge over the entire operating envelope of the engine.
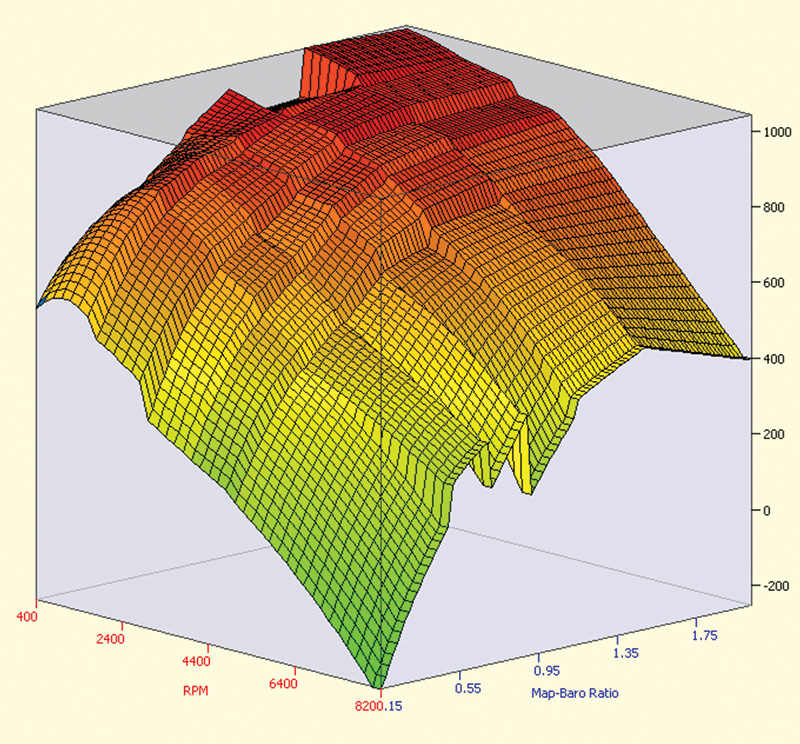
Within the ECM, the cylinder air charge across all of the various engine operating ranges is carefully mapped out through the use of multiple Volumetric Efficiency (VE) tables. The use of these tables can be characterized as speed-density as mentioned earlier. A two-axis three-dimensional table is established by using rpm along one axis and MAP along the other. When the ECM is calibrated for the engine it is controlling, this speed density table provides the cylinder volumetric efficiency at each rpm/MAP point.
An engine equipped with variable valve timing will need to have a VE table for each of the valve timing combinations. Additionally, VE tables will exist for the two states of the intake manifold tuning valve. And if the vehicle is equipped with a turbocharger or supercharger, the MAP sensor will have to be of a design that allows for proper measurements of pressure above atmospheric.
Service Issues
The number one killer of mass air flow sensors is dirt and foreign debris. Often this dirt and debris can be introduced during service. The air filter is a crucial element and, although it seems as if this is a simple component, special care and handling should be always be a priority. Here’s a short list of items to take into consideration during filter service:
- Never remove the filter with the engine running.
- When inspecting the filter, be sure to check the areas where the filter seals in the housing.
- When installing the filter, make sure that you are installing it in the correct sequence.
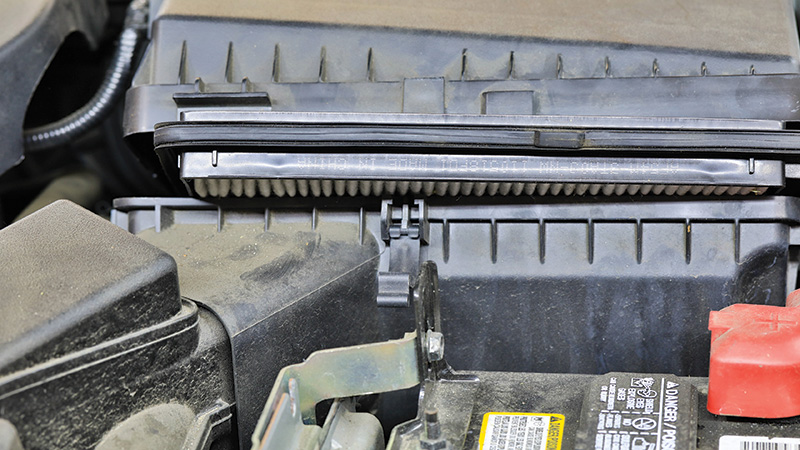
The air filter housing can be a little tricky and if one isn’t careful, a critical seal can become dislodged, placing the filter in a deficient state. Many filters today are designed to provide fairly quick and simple access as shown in Figure 3.
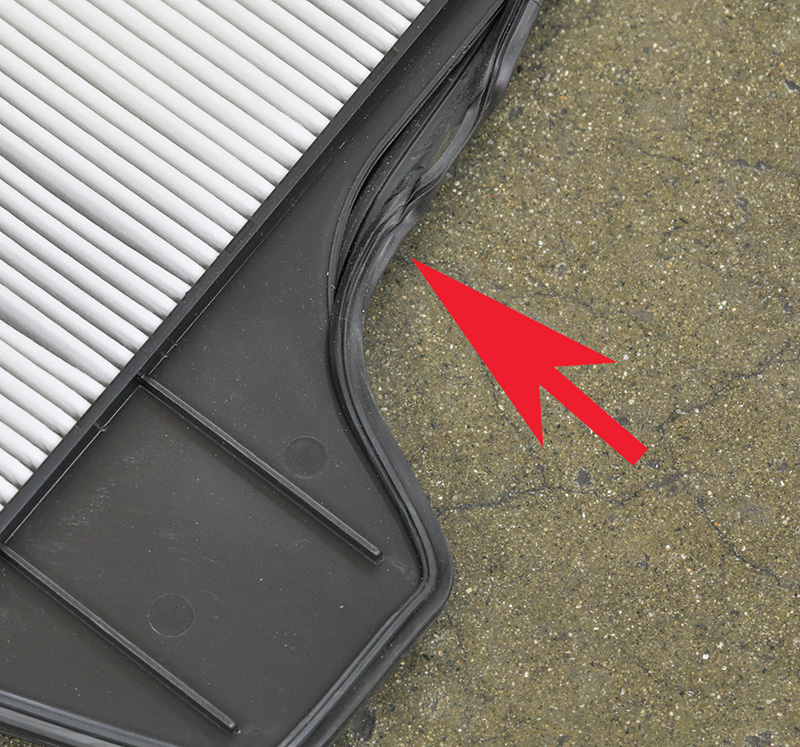
The filter housing shown in Figure 3 is from a 2017 Altima with the 2.5 L QR25DE engine. Upon close inspection, a damaged filter seal was discovered. This was likely due to faulty filter installation as shown in Figure 4. This particular application requires that the technician insert the filter and seat it into the upper part of the housing before closing and securing the latches.
Case Study
A 2016 NV200 with the 2.0 L in line four cylinder was towed in after the customer reported a sudden power loss. The technician pulled the following DTC from the ECM: P0101 – Mass or Volume Air Flow A Circuit Range/Performance.
With the scan tool connected, the technician attempted to start the engine and it stalled within a few seconds, but while it was running, the engine was clearly surging. The technician then restarted the engine and used the throttle to see if the engine would run at a higher speed. The result — the engine would start, run erratically, and then stall. The technician then went back and reviewed the scan data recorded during the start/stall events described earlier.
Looking at Figure 5, you can see that the red trace shows the engine speed cycling erratically. If you look at the middle row of data, you’ll find three pids — MAF, Battery Voltage, and MAF Cylinder Air. The MAF sensor looks fairly steady even though we have the Y axis scaling set to display 0 – 25 grams per second. The MAF Cylinder Air pid is a math pid with one of the pids in the equation being engine speed. This pid provides us with higher resolution information directly related to cylinder fill and load.
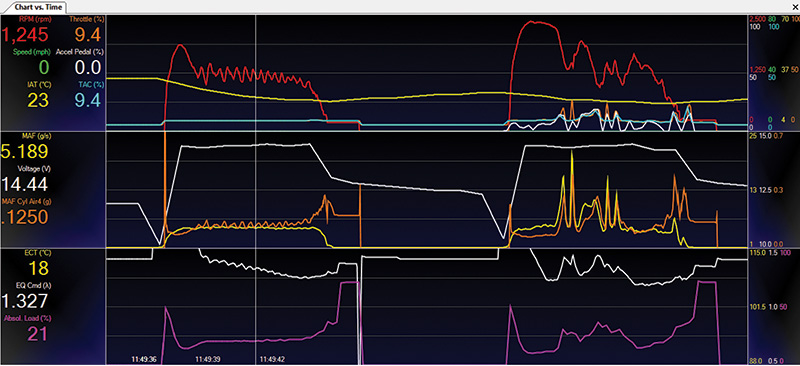
In the second start up event, (Figure 6) you can see the introduction of throttle movement to try and keep the engine running. With such an erratic operation of the MAF sensor along with the P0101 code stored, the technician moved on to inspecting the MAF sensor and air filter and housing.

When the technician removed the air filter, he found a broken air filter (Figure 7).
The technician then removed the mass air flow sensor for inspection, and observed foreign material attached to one of the sensor’s internal sensing elements (Figure 8).
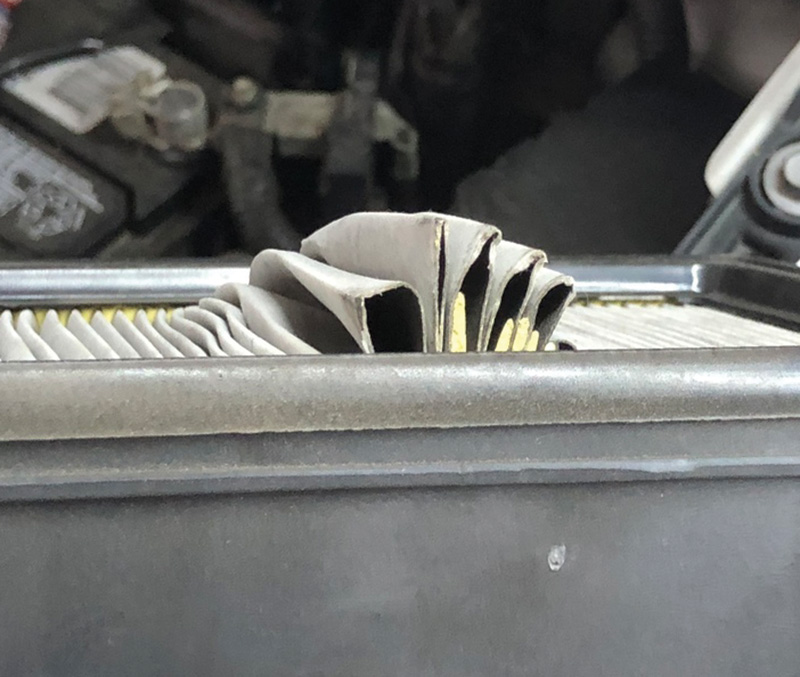
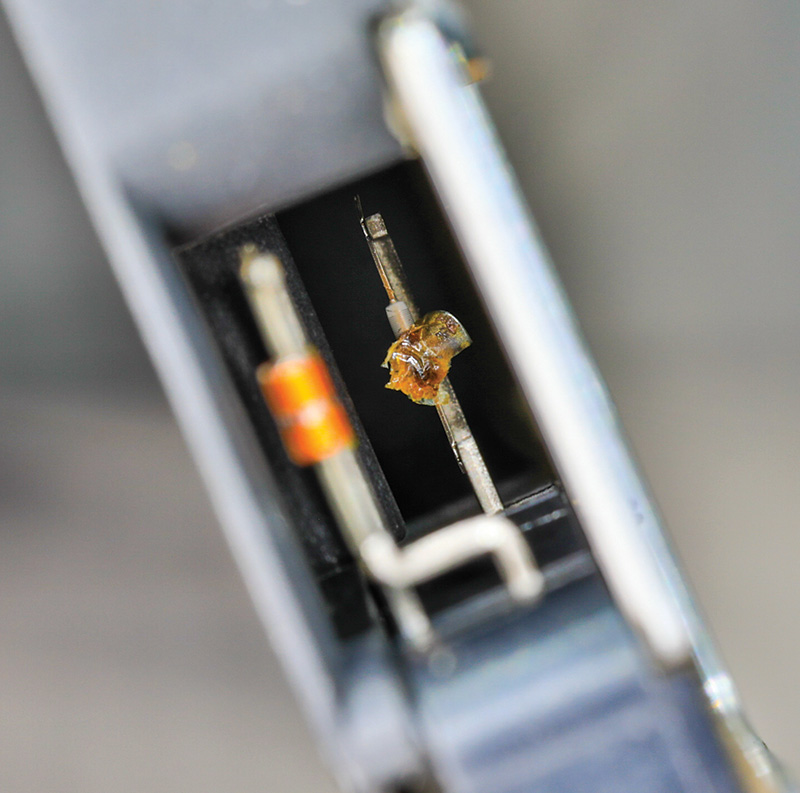
This debris was a result of the air filter that came apart, allowing a pathway for unfiltered air.
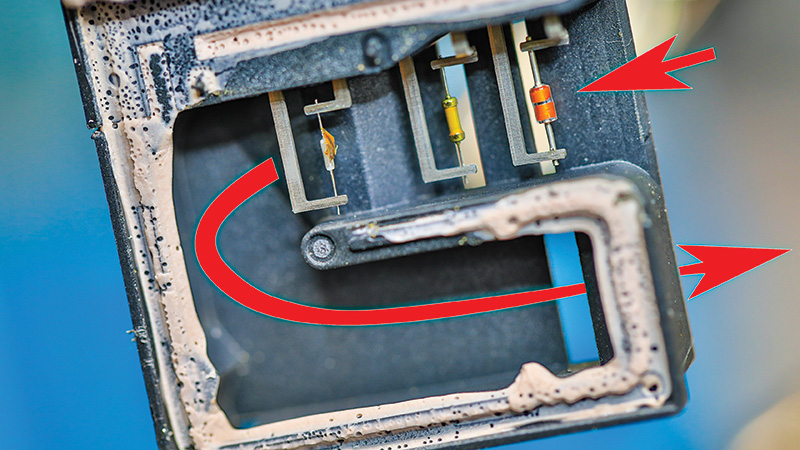
For educational purposes, this mass air flow sensor was dissected for further analysis. Figure 9 illustrates the pathway the sampled air flow signal takes as it moves through the sensor assembly.
Figure 10 shows the data collected after the vehicle received a new MAF sensor and a new air filter element.
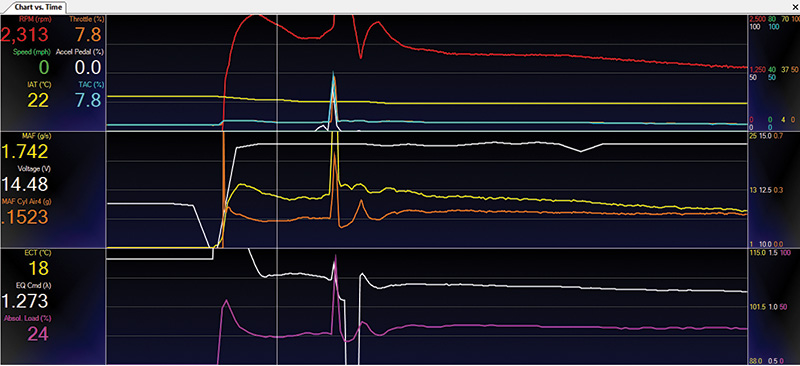
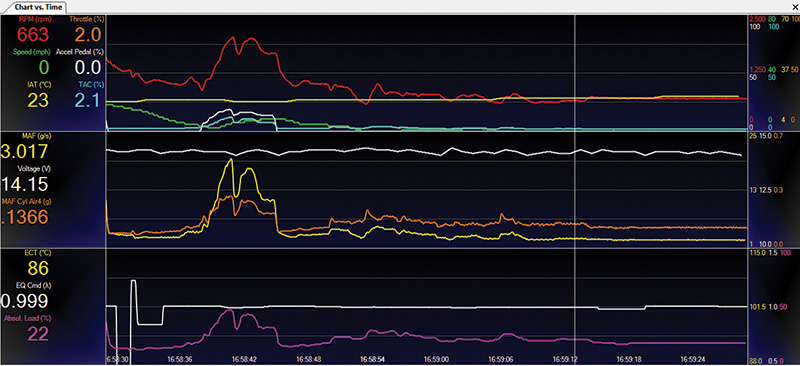
Figure 11 data shows the normal values after the proper relearn procedures were performed following an extended road test.
Air/Fuel Ratio
One of the crucial data elements the ECM needs to have in order to deliver the precise amount of fuel needed on each and every intake stroke is the mass of air within the cylinder. When the service technician is observing long term fuel trim within +/- 2% and short-term fuel trim oscillating +/- 3% across various load points, they are looking at a fuel delivery system working in harmony. The measured cylinder air flow is correct, the injector on time is correct, and everyone is happy. When the technician is presented with fuel trim numbers that sum up to +/- 30% in a given load range, then one or more of the following could be true:
- Inaccurate cylinder air charge measurements
- Fuel injector flow rate inaccuracies
- Fuel composition incorrect
- Inaccurate exhaust gas mixture measurements
Fuel trim is a vital indicator a technician can use to assess whether or not the ECM is dealing with any of the issues mentioned above.
Diagnostics
The service technician may be faced with a variety of engine performance complaints where the MAF sensor may be suspected as being faulty. It’s good standard practice for the service technician to understand how to evaluate the output of the MAF sensor. Generally, at idle, in most late model engines with clean throttle bodies and under no load hot-idle conditions, the cylinder air flow runs 0.100 – 0.125 grams per cylinder. Since grams per cylinder is dependent on engine speed, this is a better way to evaluate air flow vs. simply looking at grams per second. In order to find the cylinder air flow, the following equation can be used:
| MAF x [CONSTANT] / RPM |
The CONSTANT is based upon the number of cylinders the engine under test possesses, and can be found using the following equation:
| 120 / CYLINDER COUNT |
So, for a four-cylinder engine the constant would be 30.
Looking at Figure 11, we can use 3.017 grams/sec multiplied by 30 to arrive at 90.51.
We then take 90.51/663 rpm to arrive at 0.136 grams per cylinder, just as Figure 11 shows.
As another test to see if the sensor is capable of providing the maximum values, one can perform a Volumetric Efficiency (VE) test. In order to run the VE test, we’ll need to be able to drive the vehicle safely while going to WOT and crossing the rpm region where the engine torque output is rated.
A 2019 Rogue Sport 4WD with 2.0 L 4-cylinder MR20DD engine was used to acquire this data.
This engine has a rating of 145 hp at 5600 rpm and produces 155 ft-lbs of torque at 4400 rpm.
Although we could take the numbers indicated and go out and find a VE calculator, instead we’ll test another method using scan data that only requires us to record rpm and mass air flow in grams per second. By simply using the measured cylinder air flow divided by 100% of a single cylinder displacement, we can quickly assess cylinder fill. First, we need to find how many grams of air will be needed to fill one cylinder from the vehicle under test. We can use the following formula to find cylinder fill:
| (Displacement in L / CYL COUNT) x 1.184 (see note*) |
| 2.0 L/4 = 0.500 L |
| 0.500 x 1.184 = 0.592 |
If we were able to fill one cylinder to 100% in the current vehicle under test, it would consume 0.592 grams of air.
*Note: 1.184 represents the weight of air in grams that will fill 1 liter of volume at standard temperature and pressure.
If we then take the cylinder air data collected in Figure 12, we can find the approximate VE fairly quickly:
| 0.559/0.592 = .95 | 95% VE |
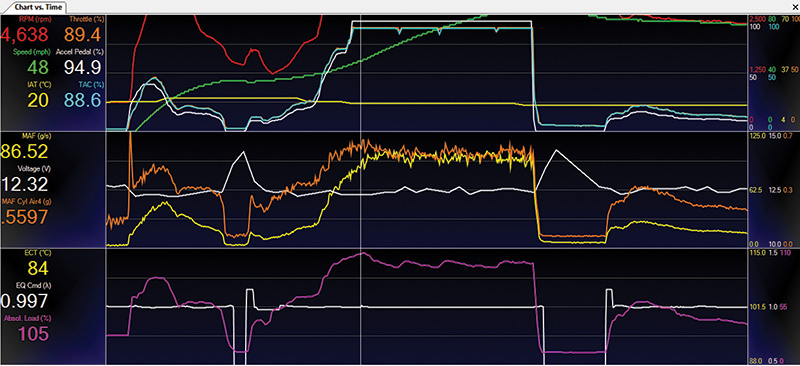
Filling the cylinder at approximately 95% is considered excellent for a naturally aspirated engine. Looking further at our data pids, you’ll note that Absolute Load in the lower row is reporting 105% and begins to drop off as engine speed increases. This is because the engine pumping efficiency falls off at higher engine speeds. For more info on load pids please see the “Calculated Load vs. Absolute Load†sidebar, on the next page.
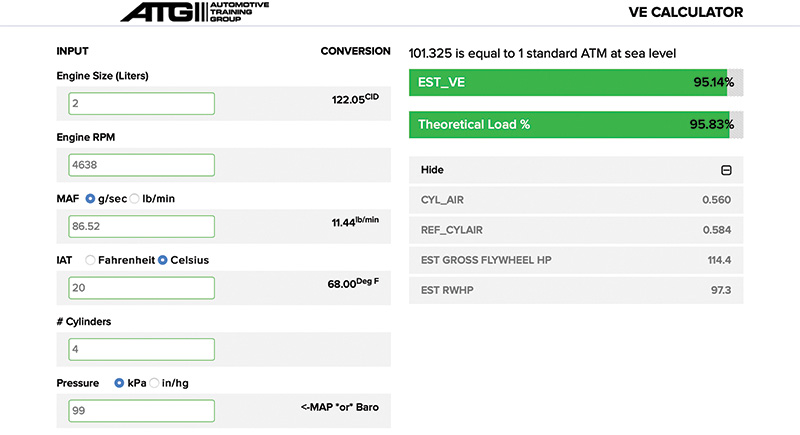
For comparison, we’ll take the data to an online VE calculator and see how our data compares as shown in Figure 13. Our cylinder air flow quick calculation pretty much mirrored that produced in the VE calculator test. However, the data here can be subjective. The quick test method proposed does not take into account atmospheric conditions such as temperature, pressure, and altitude, so please keep that in mind when using this method.
Calculated Load vs. Absolute Load
Calculated Load Value
Units: % Range: 0 — 100%
The OBD regulations previously defined Calculate Load Value as:
| (current air flow/peak air flow @ sea level) x (BARO @ sea level/BARO) x 100% |
Various manufacturers have implemented this calculation in a variety of ways.
Absolute Load Value
Units: % Range: 0 — 400%
The Absolute Load Value has some different characteristics than the LOAD_PCT PID. This definition, although restrictive, will standardize the calculation. LOAD_ABS is the normalized value of air mass per intake stroke displayed as a percentage:
| LOAD_ABS = | [air mass (g/intake stroke)] | |
| 1.184 (g/liter) x cylinder displacement (liters/intake stroke) |


0 Comments