
Almost guru Voodoo in the past, five-gas exhaust analyzers and inexpensive A/F measuring equipment makes it more scientific, and your results more successful.

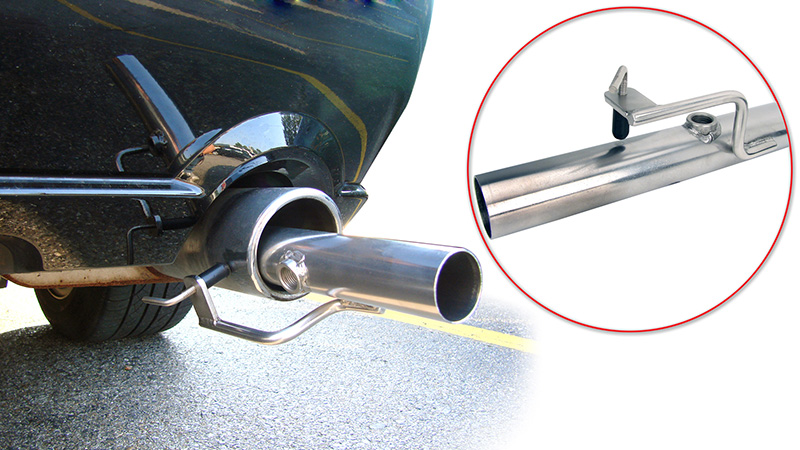
This Innovate probe is simply inserted into the tailpipe.
The ability to determine, then tune the air/fuel mixture of either a carbureted or fuel injected engine has often been thought of as a black art that very few people could do properly. The advances in air/fuel mixture reading technology, however, have made it possible for almost anyone to observe the mixture at any engine operating condition. These readings will help you tune the engine for maximum power, maximum fuel efficiency, or the lowest possible exhaust emissions. The proper tuning of this critical ratio is one of the most important steps that should be performed on any engine, whether street or track. There is no magic setting that will work for every engine, and performance tuning is part art and part science.
To state what should be obvious, an engine that’s tuned to provide each cylinder with the ideal air/fuel mixture along with the ideal ignition spark timing will more than likely perform better than a similar engine that has not been properly tuned.
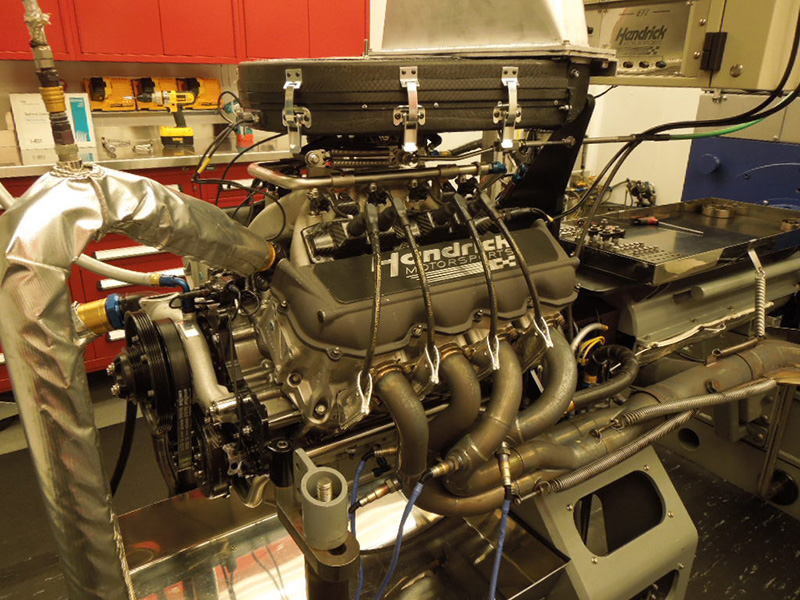
While tuning on a dyno is interesting and instructive, it can’t duplicate real-world conditions.
Dyno or real deal?
If you are installing a new or rebuilt engine in a vehicle, it is to be hoped that the engine builder can provide you with air/fuel mixture recommendations (and ignition spark advance curves) so that the engine can be tuned to perform properly from the beginning. If you do not have access to tuning guideline, you’ll have to determine what air/fuel mixture setting and ignition spark timing the engine will perform best with by tuning the engine in the vehicle during real-world operating conditions. An engine or chassis dyno can also be used to tune an engine for maximum power, but it cannot duplicate those real-world conditions the engine will actually see (such as the G-forces the engine itself and the fuel system will experience during a race). Tuning the engine in the vehicle at the track during the real deal is not just recommended, it is critical if you expect to achieve the most power possible.
If you are tuning on a dynamometer, be sure that you match the inlet air temperature and pressure to what will be experienced in competition or on the street or all your tuning work will be meaningless. You should also keep in mind that inlet air temperature is very important when tuning any engine, but it is even more critical on a computer-controlled fuel-injected engine because the PCM (Powertrain Control Module) uses the air temp sensor signal and intake pressure (vacuum) readings to calculate what ignition spark timing and fuel injector pulse command it should use.
Reading plugs and pipes is old hat
Back in the days of leaded gasoline, a good tuner could get a good idea of what was happening in the cylinders by using an illuminated magnifying glass to look at the color of the insulator nose of the spark plugs just above where the insulator comes through the steel case. If the mixture is too lean, it will leave no color, while a rich mixture will cause the “fuel ring” to become more prominent. Over-rich mixtures will give the plug a sooty appearance.
Pulling the header off and looking at the color of the exhaust ports in the cylinder head and at the first six inches of the exhaust headers is also used as a way to determine what the air/fuel mixture is, but the header and spark plug color can only show what the air/fuel mixture was at the last load condition encountered before you did the check. In the days of leaded gasoline and point ignition, this method worked well, but today reformulated unleaded fuels and high-energy ignition systems have made this much more difficult because very little color is ever seen on the spark plug. On the other hand, looking at the insulator for signs of detonation, which is seen as specks of aluminum, can still be an effective way to determine if the ignition timing is too far advanced for the octane rating of the fuel being used.
Engine builders also use exhaust gas temperature sensors when they are tuning an engine on a dyno, but the temperature of the exhaust gas really only indicates the temperature of the combustion gases, not the true air/fuel ratio, or the amount of power the engine is producing. For example, if you do not have enough ignition spark advance you will see the exhaust gas temperature go up, but that increase may actually mean that less power is being produced — there is more unused energy in the exhaust gases, which then burns in the exhaust ports and header pipes. That energy should’ve been expended inside the cylinders.
Two tools
The FAST A/F ratio meter uses a test pipe with a bung for the sensor.
Today, most tuners are taking advantage of the advances in exhaust gas analyzing technology that read and record the air/fuel mixture at any rpm or operating condition at a very affordable price. The two most accurate tools used to read the holy ratio are a five-gas exhaust analyzer and a wide-band A/F (Air/Fuel) sensor-based digital air/fuel meter. Both have their strong points and weak points, but when you use your intelligence to interpret what both are telling you, you’ll be well on your way to tuning success.
A modern infrared exhaust gas analyzer allows you to determine what the air/fuel mixture is by looking at five of the elements in the exhaust gas. The readings are very accurate and reliable, but the response time is in the 10 to 15 second range.
A wide-band A/F sensor-based digital air/fuel meter system has a response time of less than a second, but since it determines what the mixture is by looking at the oxygen/unburned combustibles in the engines exhaust it can give you false readings. These faulty readings are often the result of problems such as a misfire or an exhaust leak — the sensor reads the extra oxygen that’s arriving at its business end even though it’s really just outside air. Also, the sensor can be damaged if it is exposed to leaded gasoline, oil, or certain silicone sealants, plus its accuracy will degrade over time due to exposure to the byproducts of the combustion process.
Sensor history and technology
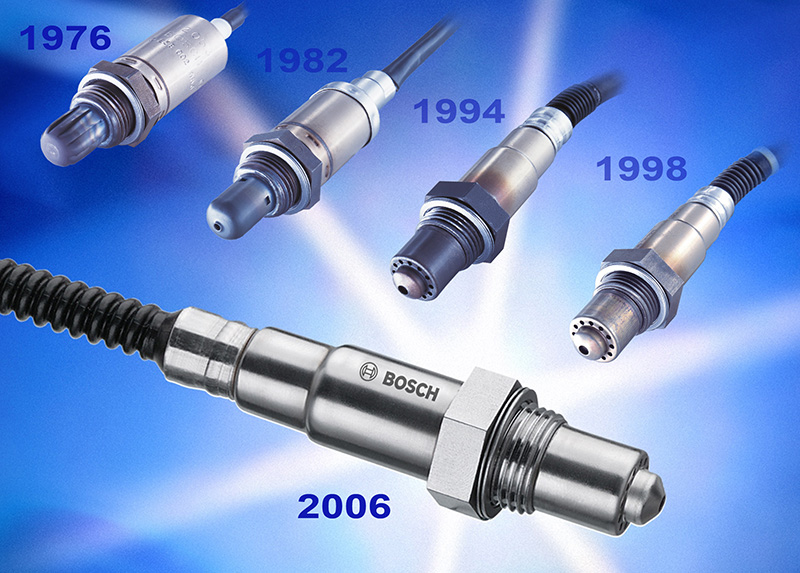
Mixture monitoring sensors have evolved from the one-wire thimble type through planar to the AFR sensors of today (courtesy Robert Bosch).
A discussion of the science and evolution of “oxygen sensors” (an inaccurate term we’re stuck with) is appropriate here. Believe it or not, it was in the 1960s when Robert Bosch GmbH of Germany started research into the idea of electronically monitoring an engine’s air/fuel ratio continuously so that adjustments to the amount of gasoline delivered for combustion could be made dynamically. The “Nernst cell” principle was used to generate a voltage signal from the electrical potential between ambient air and the gases in the exhaust stream. Such a signal could be interpreted by electronic logic, which would then make decisions on how much fuel should be added to the intake air to produce a near-ideal charge. In 1976, Swedish car makers Volvo and SAAB working with Bosch engineers introduced the Lambda Sond feedback system that put the principle into practice.
Although two-way (meaning hydrocarbons and carbon monoxide) oxidation-type catalytic converters were already in use to cut the release of those gases into the atmosphere, getting rid of oxides of nitrogen emissions required the adoption of the three-way “reduction” catalyst (reducing NOx to harmless nitrogen and oxygen), which in turn depends on near-perfect “Lambda” (in engineering language, the Greek letter that represents the ideal stoichiometric 14.7:1 air/fuel ratio by weight) to do its job.
The original oxygen sensor comprised a steel housing with a hex and threads, a louvered shield over the tip, and a hollow cone-shaped “thimble” made of zirconium dioxide (ZrO2), which is coated inside and out with a thin layer of micro‑porous platinum. The outer layer is exposed to the exhaust stream, while the inner layer is vented to the atmosphere and attached to a single wire that runs to the engine management computer.
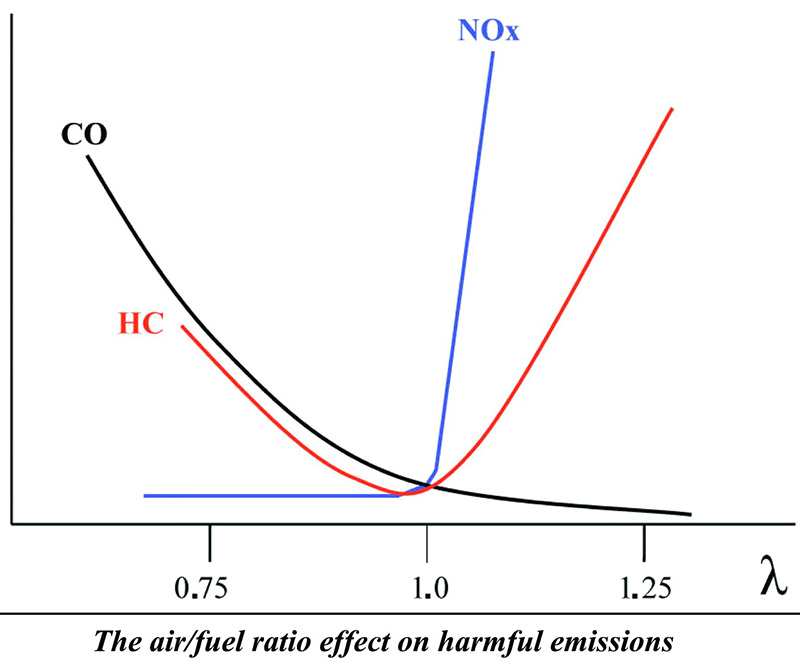
This is how exhaust gas emissions rise and fall in relation to the Lambda value. Generally, emissions increase whenever the mixture is not stoichiometric, which air/fuel ratio is represented by the number “1.”
This is essentially a galvanic cell — the zirconium dioxide acts as the electrolyte, and the platinum layers serve as electrodes. Once the ZrO2 reaches about 600 deg. F. it becomes electrically conductive and attracts negatively‑charged ions of oxygen. These ions collect on the inner and outer platinum surfaces. Naturally, there is more oxygen in plain air than in exhaust, so the inner electrode will always collect more ions than the outer electrode, and this causes an electrical potential — electrons will flow.
When the engine is running lean, more oxygen will be present in the exhaust stream than when it is rich. That means there will be more ions on the outer electrode, a smaller electrical potential, and less voltage. Just remember “L=L” for Lean=Low.
The voltage produced is small, never exceeding 1.3V (or, 1,300mV) or so, with a typical operating range being between 100 and 900mV. This is sufficient for the computer to read, however. If it receives a sensor signal of less than about 450mV, it recognizes a lean condition, and if it gets more than that amount of voltage, it sees rich running. Either way, it instantly corrects by adjusting the injection pulse width (the length of time the injectors are energized per combustion cycle in milleseconds).
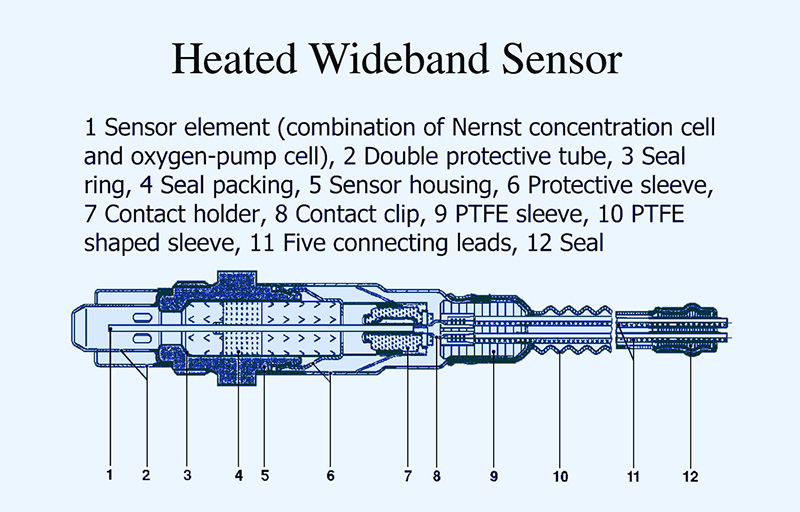
If you have not yet encountered the wide-band oxygen sensor, it is time to get familiar with it. This is what it looks like inside. Note that the pumping cell allows it to produce a signal directly proportional to the air/fuel ratio, as opposed to the high and low switching of traditional oxygen sensors.
The next step in the development of Lambda probes was the addition of an electrical heating element in the early 1980s. As already mentioned, the sensor has to reach 600 deg. F. before it can generate a signal, and this heat source causes it to get to that temperature faster than it would from exposure to exhaust alone. It also prevents it from cooling off during idle, which can throw the system into open-loop.
The “planar” sensor, which appeared in the mid-1990s, was another big improvement. Instead of a heavy thimble, planar sensors have a flat ZrO2 element (less than 2mm thick) projecting into the exhaust stream. The electrodes, conductive ceramic layer, and heater are laminated into a unified strip that is smaller, lighter, and more resistant to contamination than the thimble design. The integrated heater element also requires less electrical power.
Another advantage is that planar sensors send signals five to seven times per second for much more precision in fuel management. To put this into historical perspective, the O2 sensors used on cars with feedback carburetors sent roughly one signal per second, and those used with throttle body injection provided only two to three signals per second.
But planars aren’t where we are today. While they’re faster and better than thimble-type sensors, they still operate in basically the same manner. At stoichiometric, when the air/fuel ratio is perfectly balanced, conventional sensors have an output voltage of about 0.45V (450mV). When the fuel mixture goes even a little rich, the sensor’s voltage output does not just increase slightly. It shoots up to its maximum output of about 0.9V. When the mixture is lean, sensor output quickly drops to 0.1V. Every time the oxygen sensor’s output jumps back and forth, the computer responds by decreasing or increasing the amount of fuel delivered to the combustion chamber. The rapid flip-flopping achieves something approaching an average stoichiometric condition. But averages are not good enough for optimal fuel efficiency and the latest emission control standards. More precise control over the air/fuel ratio is needed.

From left to right, these FAST meters measure ethanol/methanol, diesel, and gasoline air/fuel ratios.
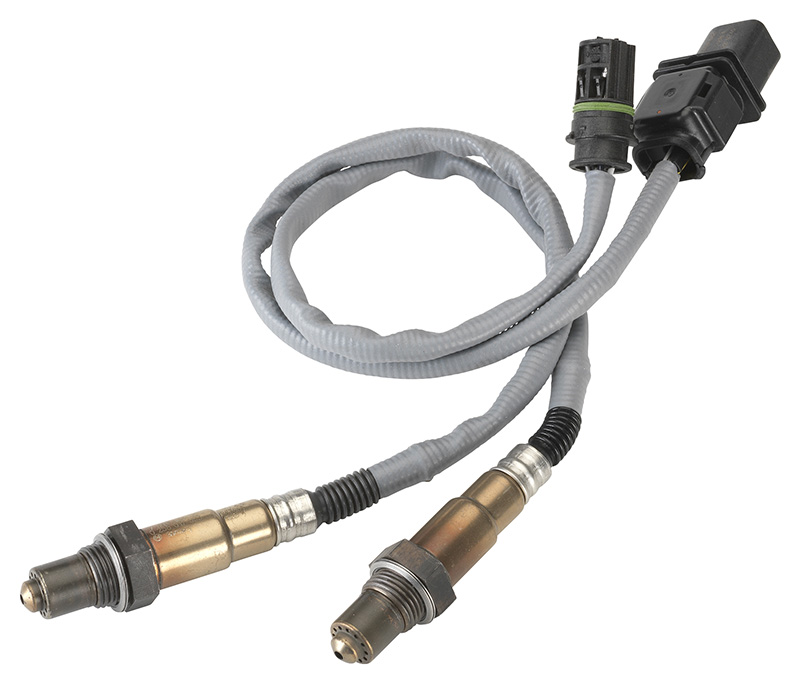
Although it may look very similar to a planar sensor from the outside, the wide-band type sends a completely different kind of signal to the computer, which results in much more accurate mixture control than can be achieved with the “dithering” of a regular thimble or planar oxygen sensor. These are the Robert Bosch LSU 4.9 units commonly used in high-performance tuning
(courtesy Bosch Motorsports).
Everything changed when the wide-band sensor (also known as a wide-range, air/fuel, AFR, or lean sensor) appeared in the late-1990s, which has made lean-burn engines with stunningly efficient characteristics possible. It doesn’t simply send a lean/rich toggle. Instead, it tells the computer how lean or rich the mixture is by providing useable linear output over a wide range of a/f ratios.
It adds an electrochemical “pumping cell” to the planar sensor’s layered ceramic strip. This pumps a sample of the oxygen in the exhaust into a “diffusion” gap within the sensor. The sensor is designed so that a certain amount of current is needed to maintain a balanced oxygen level in the diffusion gap. This current is directly proportional to the oxygen level in the exhaust, and amounts to an analog input to the computer. This is superior in speed and accuracy to simply switching rich to lean at the 450mV threshold.
A wideband AFR sensor provides precise readings for air-fuel ratios from very rich (Lambda 0.7, or an air/fuel ratio of about 11:1) to pure air, no fuel. The sensor receives a reference voltage from the computer and generates a signal that corresponds to the fuel mixture. It operates at a temperature about twice that of older O2 sensor designs, and it reaches this within 20 seconds after a cold start. Response time to changes in air/fuel ratios is less than 100 milliseconds, much faster than that of any previous sensor, which provides optimal mixture management. It also makes it ideal for tuning purposes.
Even AFR sensors can be fooled if there is an air leak between the exhaust manifold and head, or by a misfire that pumps an unburned air/fuel charge into the exhaust. These situations cause a false signal that makes the ECM mistakenly adjust the mixture.
In practice
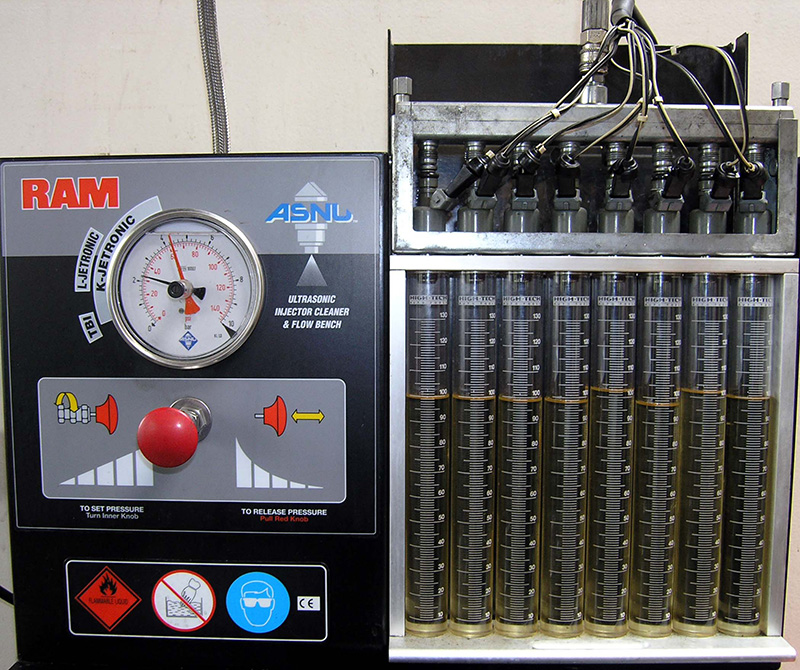
An injector flow bench is the gold standard of finding out how much fuel is actually being delivered to each cylinder.
Most of the digital air/fuel meters base their readings on the Lambda scale; it is then converted to air/fuel mixture based on the fuel being burned. A Lambda value of 1.0 (stoichiometric) is the chemically perfect ratio of air-to-fuel for a complete burn. For pure gasoline, that is 14.7 lbs. of air for 1 lb. of fuel, but the stoichiometric mixture is different for every fuel. Some may need 14.7 lbs. of air for a complete burn of a pound of fuel, while others may need six lbs. of air . Many tuners believe that it is better to read air-to-fuel ratios in Lambda since it will be accurate with any fuel, but you should use the readings you are most comfortable with.
There are several different brands of wide-band A/F sensor-based mixture meters on the market, such as unit sold by FAST (Fuel Air Spark Technology). Many of these systems have data recording capabilities so you can record and play back the A/F ratio readings, plus things such as throttle position, engine rpm, air temperature, engine vacuum, and so on. If you are doing advanced tuning of the air/fuel mixture for each cylinder, Bosch Motorsports offers a Lambdatronic LT4 controller. This provides controlled pumping current to supply up to four sensors. The Lambda value, the sensor temperature, and diagnostics are available via the CAN (Controller Area Network), or an analog signal. Many of the top NASCAR teams use the Bosch LSU 4.9, mounting it in the collector of the headers. For fuel distribution tests, they use one Bosch LSU 4.2 sensor in the header tube of each cylinder because it is more durable than the LSU 4.9.
It is common for the air/fuel mixture to vary from cylinder to cylinder in production engines. This can be caused by the design of the intake manifold, the normal variance of fuel flow from the fuel injectors (if used), or the G-forces the engine will experience during real-world operating conditions. Advanced tuning using one AFS for each cylinder can allow a tuner to read the air/fuel mixture of each cylinder. One of the pioneers in tuning carburetor-equipped race engines is Keith Wilson of Wilson Manifolds, who uses the readings he gets from one sensor in each header tube. Keith is then able to modify the intake manifolds of NASCAR and NHRA Pro Stock engines to ensure that each cylinder of the engine has the ideal air/fuel mixture during the high G-force conditions they experience during a race. A fuel injector flow bench, such as the ASNU unit we use, can allow you to perform flow tests on the injectors themselves to find out if fuel delivery is uniform for all, which is a great tuning tool. For those of you who want to do some further reading on how much the air/fuel mixture can vary from cylinder to cylinder, the Society of Automotive Engineers has a paper 1999-01-1170 titled “The Determination of Air/Fuel Ratio Differences Between Cylinders in a Production Engine Using Exhaust Gas Oxygen Sensors.”
In tandem
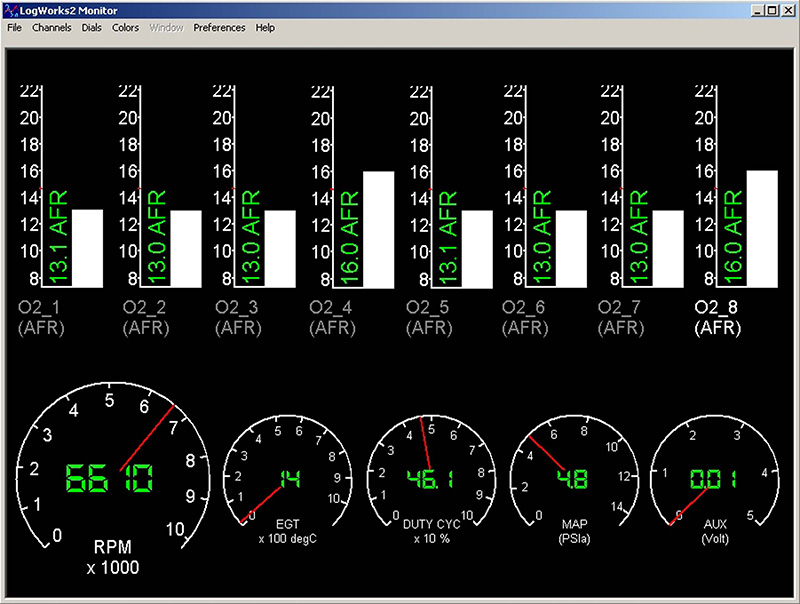
Here are the A/F ratio readings of all eight separate cylinders at 6,600 rpm. Note that #4 and #8 are leaner than the others.
In my mind, the best results are provided by using both the exhaust gas analyzer and the wide-band air/fuel meter methods in tandem. In the final analysis, the more sophisticated the instrumentation gets, the more careful you have to be with the data you get. Gas analyzers are really good, as are digital air/fuel meters, but care must be taken to make sure you are really seeing what you think you are seeing! There are countless examples of someone tuning the A/F mixture with a digital meter where the reading indicated that the mixture was extremely lean when it was actually not lean at all — the false lean reading was being caused by engine misfire. If you were to use a five-gas exhaust gas analyzer in such a case, you would be able to see the misfire problem. Once the ignition or engine mechanical issues are corrected, both the digital air/fuel meter and the exhaust gas analyzer will show you the same correct air/fuel mixture readings.
The readings from an infrared exhaust gas analyzer will allow a tuner to observe the air/fuel mixture, engine misfire rate, engine combustion efficiency, and excessive combustion chamber heat (typically from detonation). These readings can help an experienced tuner figure out what air/fuel mixture is needed and if the spark timing is too advanced.
A five-gas exhaust analyzer reads:
- CO (Carbon Monoxide), an indication of the air/fuel ratio (CO is partially burned fuel).
- HC (Hydrocarbons), which represents the amount of unburned fuel in the exhaust (suggesting misfire).
- CO2 (Carbon Dioxide), the product of complete combustion — the best A/F mixture gives you the highest CO2 reading. The ideal ignition timing advance will also create the highest CO2 reading.
- O2 (Oxygen) — high O2 indicates a lean mixture, an exhaust leak, or perhaps that the engine has a “hot” cam. Note: if O2 content is above 2 to 3 percent, air dilution of the exhaust gases being measured is indicated and the accuracy of the all of the gas readings may be way off.
- NOx (Oxides of Nitrogen), the gas that’s created by excessive combustion chamber heat. This reading can be used as an indicator of detonation caused by excessive spark advance, or perhaps the octane rating of the fuel is too low for the needs of the engine.
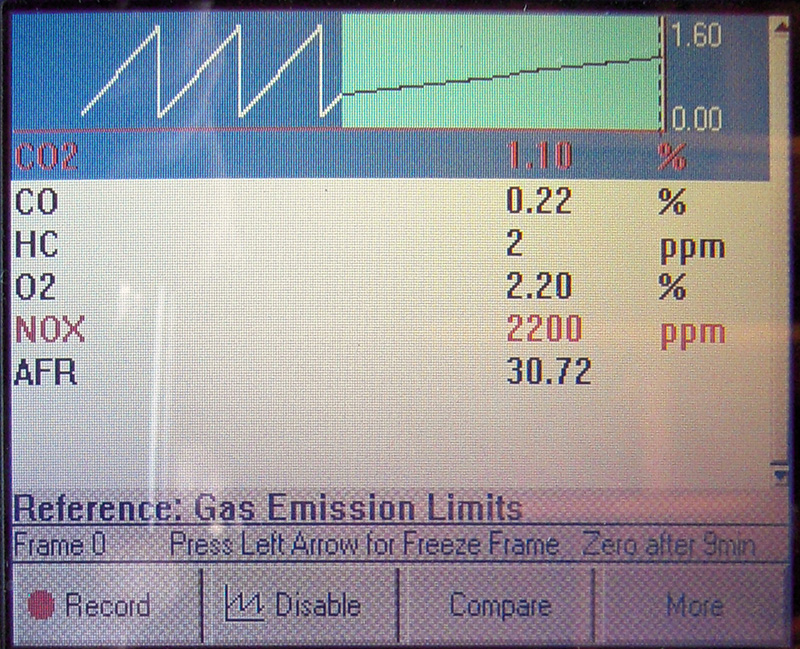
Reading the five important exhaust gases on an OTC Genisys EVO.
A lean fuel mixture (too little fuel for the amount of air in the cylinder) can cause an engine to have a surge or miss at idle and part throttle, stumble on acceleration, overheating, lack of power, or it can lead to serious internal engine damage. A rich fuel mixture (too much fuel for the amount of air in the cylinder) can cause an engine to “load up” at idle, foul the spark plugs, and also lack power or run sluggishly. The other negative effects of an overly rich mix are poor fuel economy, and the possibility of washing the oil off the rings and cylinder walls, which can cause serious damage to the bores, pistons, and rings.
A good starting point for the air/fuel mixture for most engines running on pure gasoline is 12.8-13.2:1, depending on combustion chamber design and how well atomized the fuel is. With that established, you can perform timed acceleration runs or top speed runs using trial-and-error jetting/programming changes to obtain the best results. The resulting air/fuel mixture reading can then be compared to the A/F ratio readings at various operating conditions.
When you operate an engine with an air/fuel mixture that is too lean, it will also not produce as much power as it should, plus it will tend to run hotter. As you lean out the mixture from the maximum power ratio, fuel economy will improve, but this will also make the driver open the throttle more to maintain the same vehicle speed. The ratio that results in maximum fuel economy can range from 14.2:1 to 15.5:1 on pure gasoline, or maybe slightly leaner depending on combustion chamber design and how well mixed and atomized the fuel is with the air. The challenge is finding a balance between the A/F ratio that will produce the maximum power, and what would provide the best possible fuel economy. When an engine has the correct air/fuel mixture for every operating condition, it will make all the power that was built into it, run cooler, and give the best mpg possible.
0 Comments