There are times when a concerned owner asks about rear bumper damage and/or observes that the Park/Steer Assist is not offering the values or warnings within the rear camera display. These experiments and tests are with the same Q3 in the service bay (from Part 1 and Part 2).
The best option is to scan the vehicle for faults, save, and delete them. Start with a fresh slate and monitor the obstructions using VCDS and move the obstructions around.
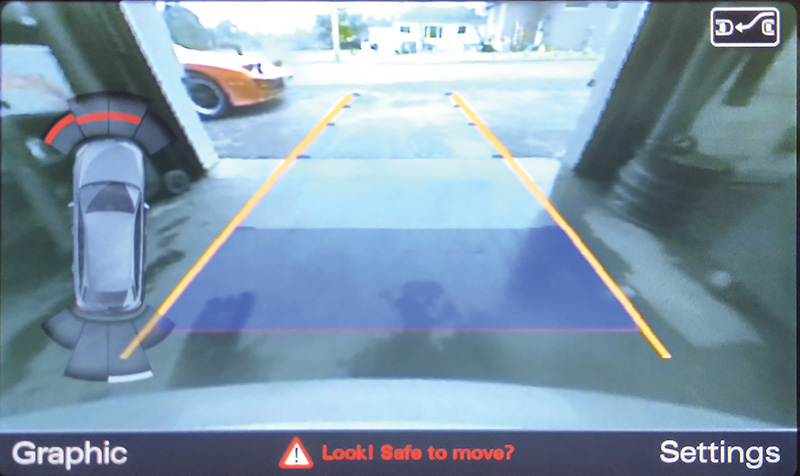
With access to open space and with an obstruction triggering the bumper sensors, have the vehicle safely blocked in the Reverse position with the rear camera operational. View the screen with and without an obstruction. At the same time, log into VCDS and view how the obstructions are affecting Park/Steer Assist measured values.
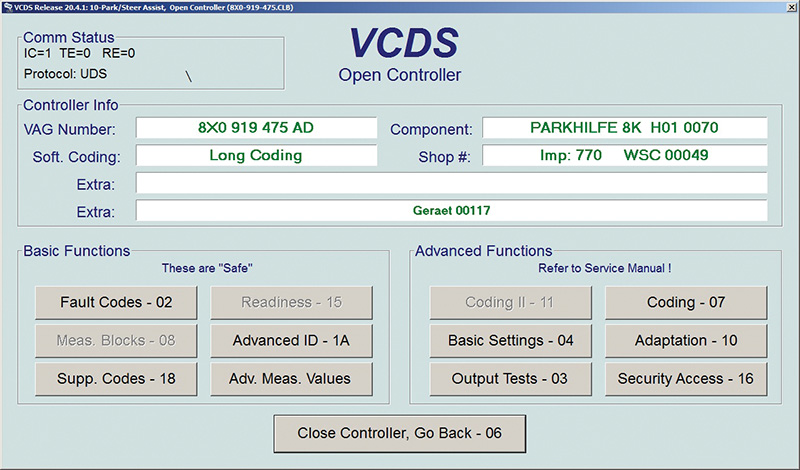
- View Park/Steer Assist Identification and request for any faults and save.
- At address 10 Park/Steer Assist, choose Adv. Meas. Values.
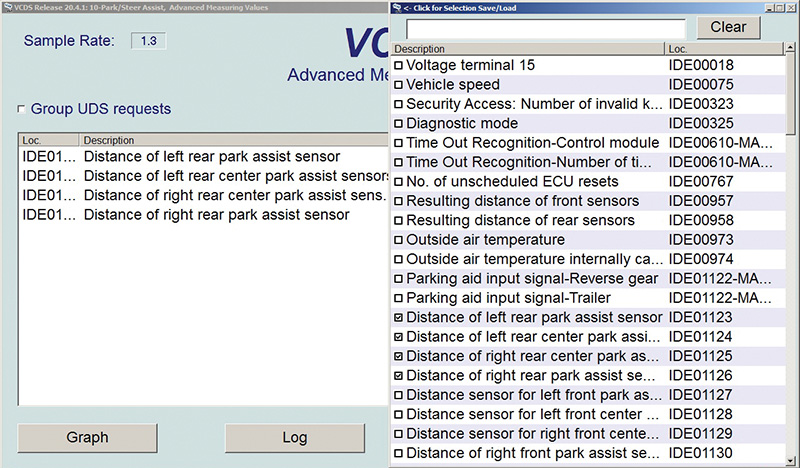
Within that option, scroll the screen until the four sensors are in view and click the boxes on the left to access the set of choices.
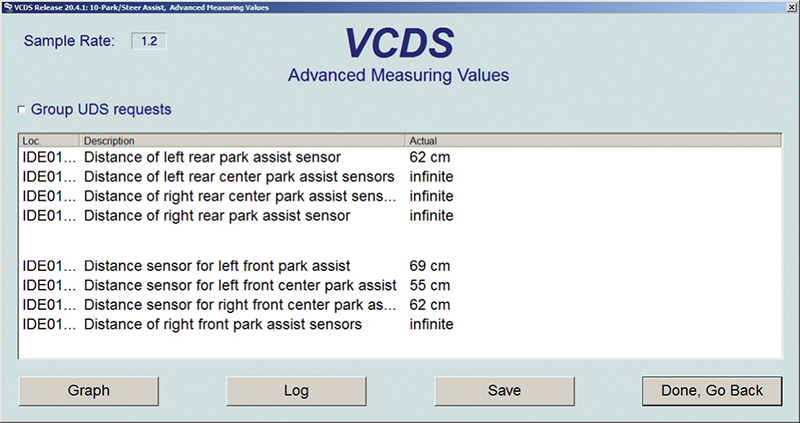
The “Two distance tests” image is two tests stitched together. The upper portion indicates an obstruction at the left rear Park Assist sensor. The lower portion indicates that the obstruction was moved towards the right side of the Q3 to trigger three sensors.
Matching the upper portion in the image, line 1 reads 62 cm.
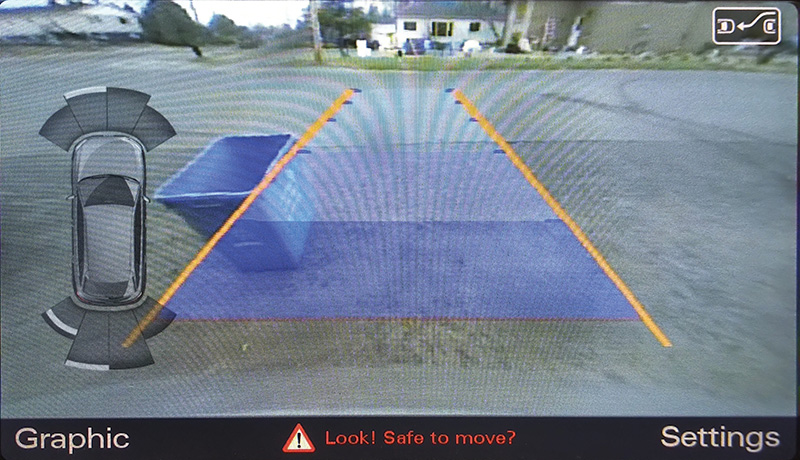
The actual Q3 screen warns the driver with tones increasing in duty cycle as distance of the ultrasonic transmitter/receiver nears an obstruction at the rear bumper.
The “Screen image 1” image offers an idea of the relationship between VCDS, the Park/Steer Assist controller, the ultrasonic transmitter/receiver(s), and the rear view camera.
VCDS will also include data from the front ultrasonic transmitter/receiver(s) if obstructions are encountered in the Drive position. Tones and changing frequencies are similar to the rear sensors. With the Q3 in the Drive position, the closer the obstruction(s), notice the frequency increase with the color of the warning bars turning from white to red.
Note: The steering angle sensor is also integrated with address 10 Park/Steer Assist. The steering angle sensor, if defective, will record faults at multiple controllers.
“Screen image 2” shows the Q3 in the Drive position and quite close to a rolling diagnostic cart in the service bay. Notice the red bars in the image.
Is there another way to test the ultrasonic testers?
Yes there is, and you can build your own “magic wand.”
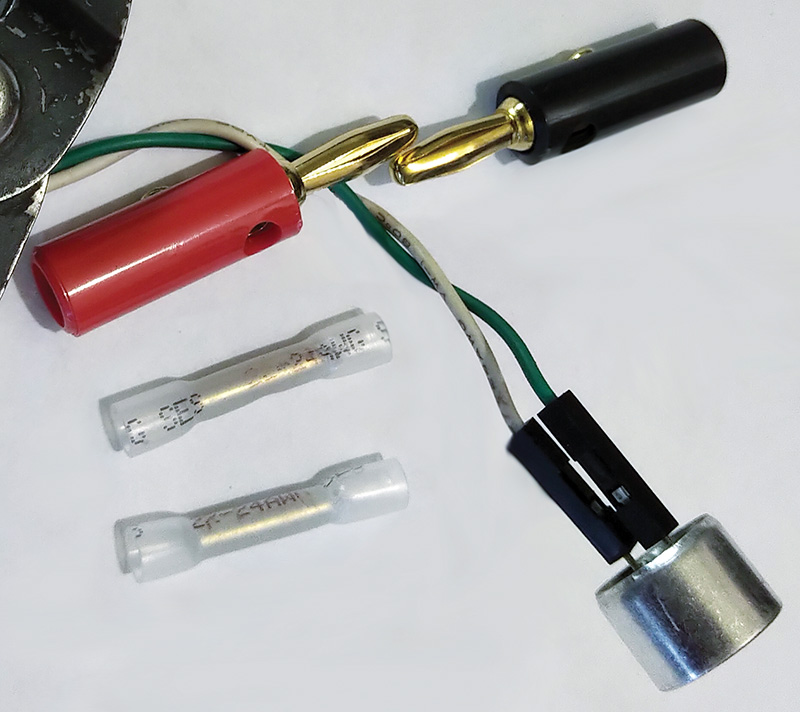
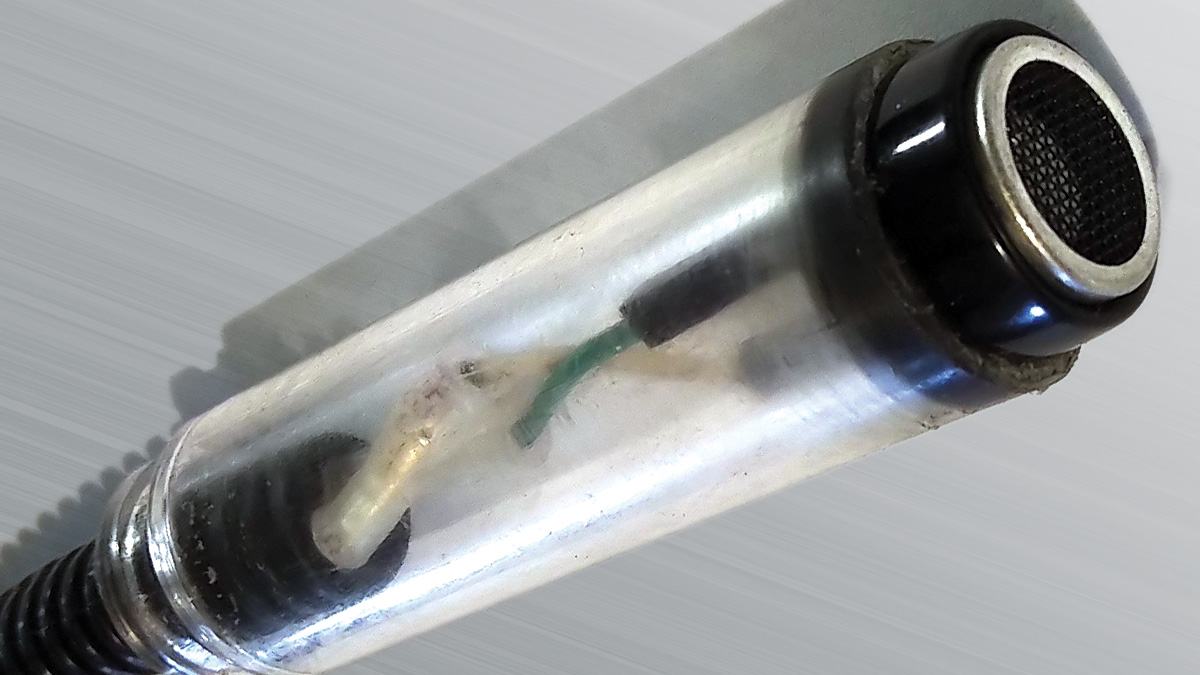
A hobby kit was found with transmitters and receivers. This is a 40 kHz package.
With a plastic “magic wand” tube cut open to fit the receiver, some old twisted CAN pairs, two banana plugs, and corrugated tube, an interesting set of tests was accomplished with an oscilloscope.
Parts used
- 40 kHz transmitter and receiver package (x2)
- White/clear crimp and shrink connector (x2)
- Twisted pair wires approximately 20 inches in length
- Corrugated tubing, tape, and shrink fit
- A plastic vial to accept and hold the receiver within the protective tubing
- BNC-to-banana connector for the oscilloscope
What signals can the oscilloscope read?
Review the “Tablet test” images, 01 through 03. These are real time values with the oscilloscope while the Q3 is in the Reverse position, blocked, and measured with a ruler.
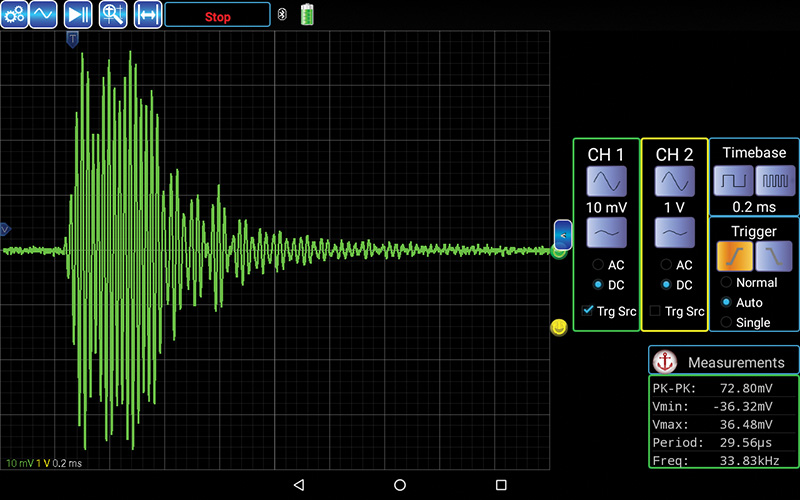
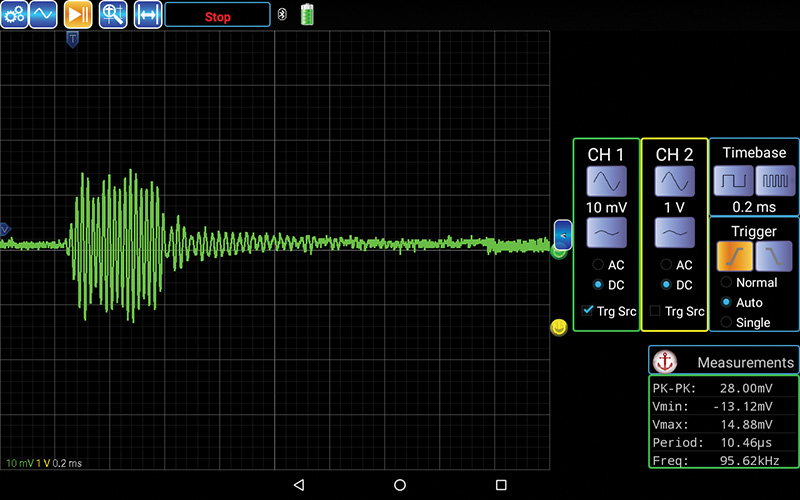
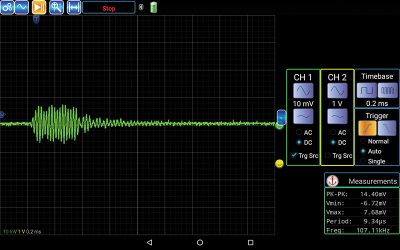
Match tests 01 to 03 with the Android tablet and Bluetooth oscilloscope attachment, “Sound Analyzer App” images.
Putting a BlackBerry phone to good use!
With an Android such as the Blackberry or Samsung, the oscilloscope feature works flawlessly to measure/test a possible defective ultrasonic signal(s), front or rear.
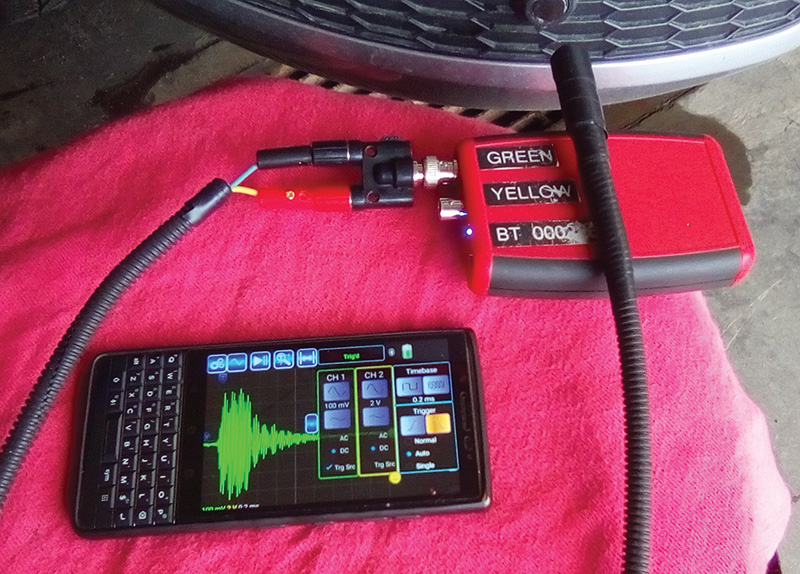
The “magic wand” was a successful experiment. The included images allow one or more sensors to be examined and tested individually for the ultrasonic bursts. Consider rear or front bumper damage with simple tools to determine sensor damage.
Are there other methods and other tests with simple equipment?
Let’s think about the ultrasonic bursts and the test device that was created to include the oscilloscope. Doesn’t the average cell phone have an internal microphone?
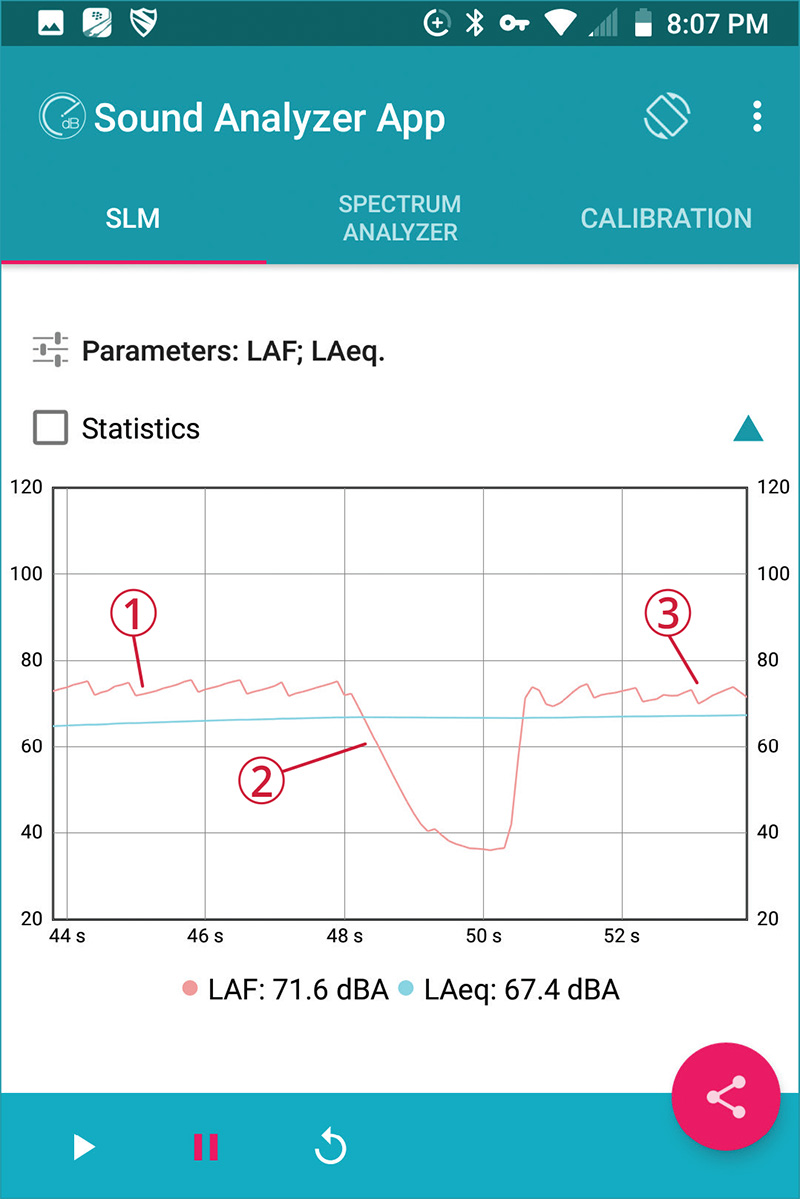
The Android applications (Sound Analyzer App 1-3) were a curiosity.
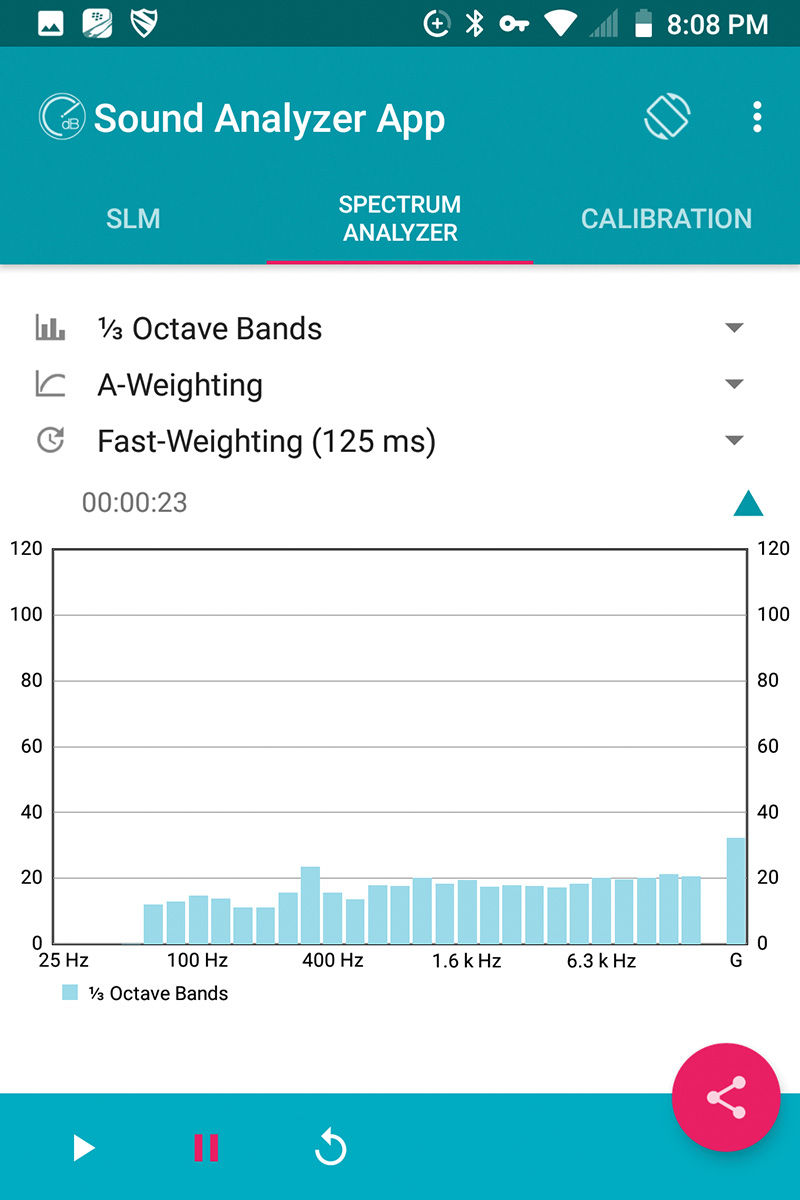
The beginning rise and wave of this image is with the microphone pointed at the bumper sensor; the drop in sound is moving the cell device up and away, a few inches from the sensor. Moving the cell device in front of the sensor raised the image and wave with the SLM feature.
Side note: This same application was used to measure interior noises when the service bay was quiet. The application was used to measure/test a clicking/groaning HVAC blend door motor when no vibrations were felt. In that case, three door motors were in close proximity to each other. Always be aware of other noises affecting the application.
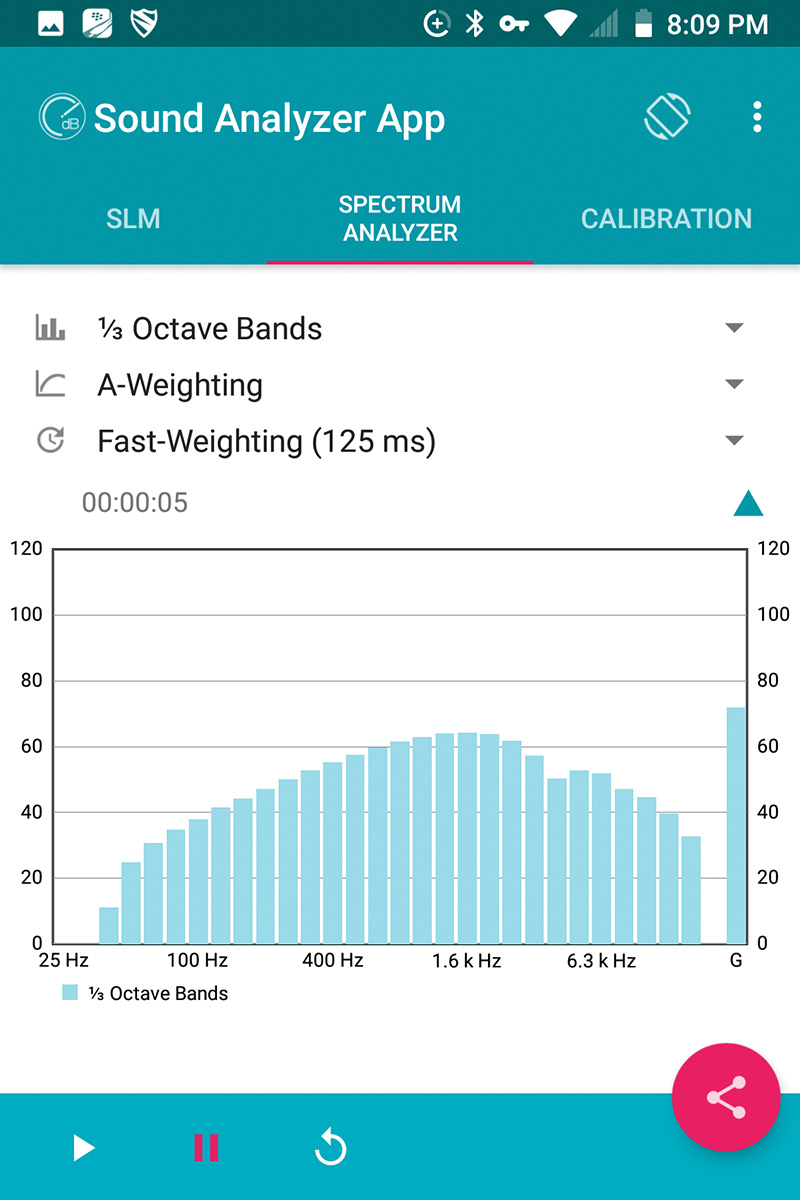
The Spectrum Analyzer feature with the Sound Analyzer App, offers a far different view. In the “Sound Analyzer App 3” image, the cell device was a few inches up and away from the sensor.
Moving the cell device towards the bumper sensor changed the spectrum analysis.
Read this link for more information: en.wikipedia.org/wiki/Spectrum_analyzer
What was learned? The experiments were a simplistic way of determining how the system worked, but the thought included a device carried in a pocket. The device has the Bluetooth oscilloscope feature along with a sound analysis application(s).
Can it be put to use for other purposes in this field of study?
Doctors practice on human subjects, the difference is we bring our subjects back to life.
Frankenstein version!
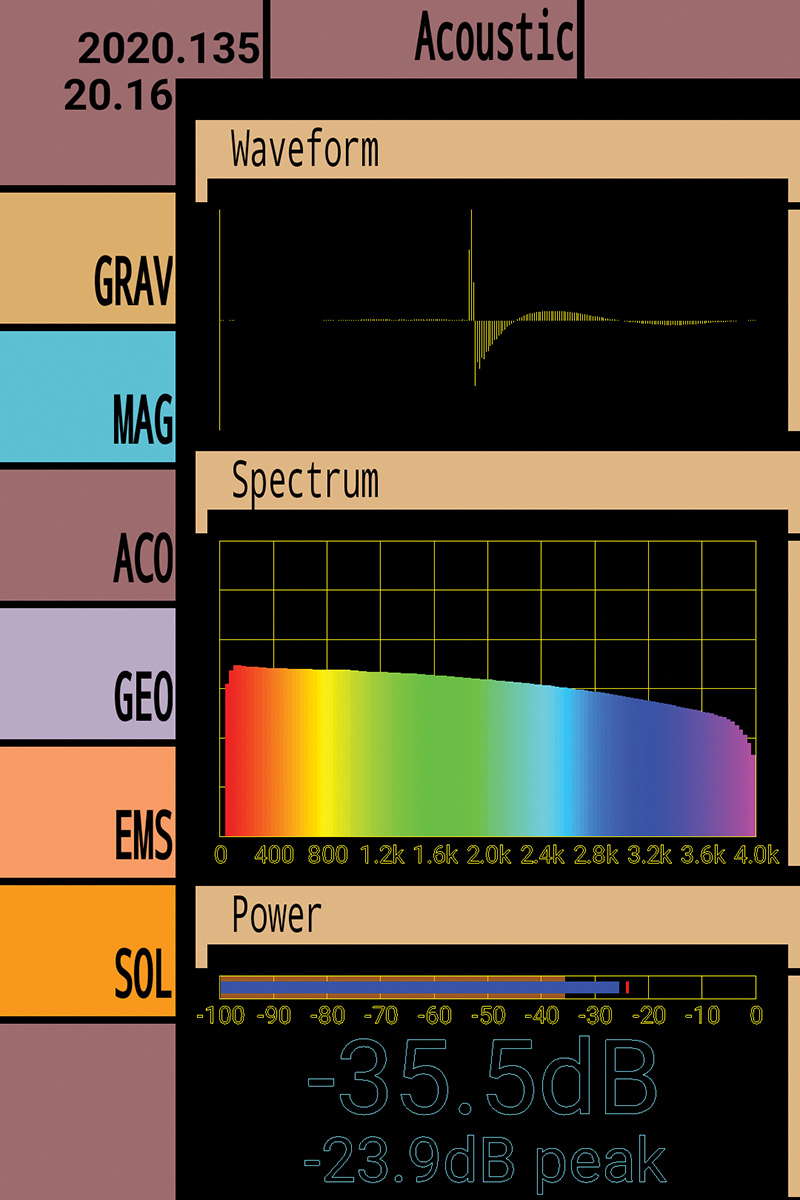
Past articles presented this application called the “Tricorder” and measured the magnetic wave of a COP ignition coil. The application has access to the built in sensors of an Android device. This time the Acoustic feature (ACO) was used in the same fashion as the previous application to monitor the ultrasonic bursts when the Q3 was ready for front or rear sensor tests.
The application is found at the F-Droid repository: f-droid.org/en/packages/org.hermit.tricorder/
This is by no means accurate compared to the oscilloscope with a 40 kHz receiver, but these ideas offer something quick, noticeable, as well as experimental.
Be aware, outside/intrusion noise(s) will disturb the readings. Intrusions can be cooling/heating fans, air hammers, running or moving vehicles, or the sound of a screaming cat.
No cats were harmed with this experiment!
Last but not least, check the sensors for paint, dirt, scrapes, and any damage including to the bumper cover. Damage also includes the hidden harness assembly.
Accuracy is with VCDS and the oscilloscope.
By: Augie Ferron
0 Comments