
How Your Strategic versus Tactical Approach to Diagnostics Makes the Difference Between Sweet Success and Frustrating Failures
A lot is made of diagnostic strategy in training classes and speeches at technician conferences these days. And for good reason. However, what is often missing is the tactical discussion.
The increasing call for technicians to develop their diagnostic strategy and thought is due to several factors; not the least of which is the quantum leaps in the number of networked modules, or the multiple data transport protocols running on 15 separate networks through a gateway translator and then of course, there’s the technician’s on-going challenge of solving an increasing number of intermittent plausibility faults, which typically point us to neither circuit issues nor component faults.
To be sure, the complex diagnosis of today’s Mercedes-Benz vehicles, or any modern networked vehicle for that matter, does indeed require a good bit of diagnostic strategy when the tough ones show up in the bay. A strategy defines an overall look at how we will approach any given problem or task.
Familiar basic diagnostic strategies that have been used within in the industry over the years generally include a balanced, overall assessment of each case in front of us. Based on the complaint(s), we would for example typically search for relevant technical service bulletins (TSBs), assess the vehicle, read out fault codes, maybe test the battery (the basics) and then organize and analyze a diagnostic approach based on any DTCs present, our physical observations and commonality in the faulting systems, right?
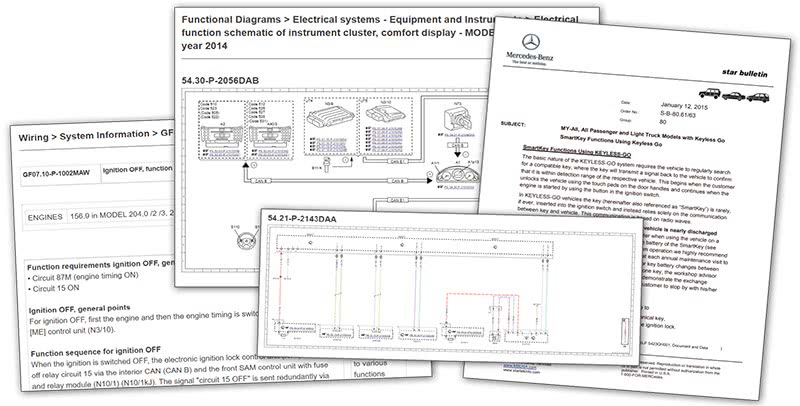
We would then pull circuit description and operation information, component location and wiring schematics, etc. That all-important entry-level research portion of our diagnostic is helping to form and shape our strategic approach to the problem. See Figure 1.
This should be the basis of all diagnostic entry, of course. Any strategic-level research process cut short, or worse, a technician looking for that quick silver bullet answer, is almost always going to lead to unnecessary parts and module replacements, hours of wasted time and frustration on behalf of the customer, the technician and shop management.
The issue for many techs that get stuck in a gnarly diagnostic is that their tactical approach may be missing entirely or leaning too heavily on the published service information alone, which can sometimes run us in circles (leading to intermittent or no condition found conclusions) or worse, fail to help us actually run down, isolate, confirm and repair the fault with any kind of certainty.
This paradigm exists because out in the field, our reality is that an active or intermittent fault doesn’t always manifest itself nor play out exactly as it appears on the bench-engineered DTC information chart.
Rogue electrons, vibrations, temperature and pressure variations, corrosion and, increasingly, internal module (electronics) component faults and software issues have the propensity to induce faults that are not, and cannot be, immediately detected, predicted, isolated or identified (AKA diagnosed) by conventional means and published service information. That’s where the tactical approach comes in.
We’ll look at a couple of frequent diagnostic scenarios here to bear this out; one involving a drivability issue and another involving a network data issue. Both are based on a relatively modern 2015 E350 car.
In contrast to the strategic approach, the tactical approach defines HOW we are going to attack our fault finding. Decisions made at the tactical level should be driven from all of the information gathered at the strategic level: TSBs, wiring schematics, DTC charts, circuit info and so forth. The tactical level is where we specifically lay hands on the car to identify and rectify the fault. But this is where it can get tricky.
Yes, there certainly are cases where we see an all-out failure of a component or wire, and in these cases, the OEM provided DTC charts and schematics can be enough to get us quickly to the answer. But this type of obvious, easy-to-see hard failure rarely occurs in actual practice.
Important Point: The nature of the faults we trace today in the field often come down to some form of outside force that creates conditions or circuit behavior that cannot be predicted within the bounds of how an OEM DTC chart is created, which is only to say that the diagnostic chart’s path is necessarily limited to the actual build and function of the vehicle itself, and not geared toward the diagnosis (or identification of) that outside force affecting it.
Now, let us state clearly that we should always follow all OEM instructions and warnings to the letter regarding voltage checks, resistance checks, data readings or calibration procedures as prescribed in OEM-published diagnostic service information, such as the Mercedes-Benz Workshop Information System (WIS). Remember that in practice, faults rarely occur when the vehicle is in a static, Key On Engine Off status while sitting idle in our bay. Nor do faults typically occur during diagnostic routines or procedures requiring physical disconnection of modules or components for voltage potential checks and continuity checks.
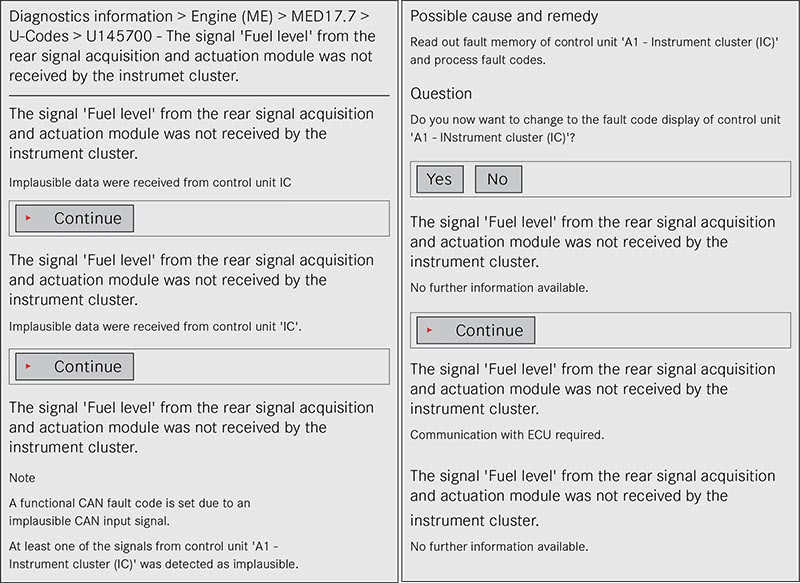
Let’s look at the case of a Motor Electronics (ME) DTC U145700 for example, on a 2015 E350. Here is a case where, due to the number of CAN nodes involved (three are called out: the ME, Rear SAM and IC), the fault-finding procedure is vague enough, a tech can easily make a diagnostic mistake. This assertion is based on the fact that the faulty messages called out are not defined as to their content or violation, but only generically and without specific diagnostic pathing or the ability to confirm the origin of the fault. This is a case where your tactics need to be considered carefully so that unneeded parts replacements are not the result of your diagnosis. See Figure 3.
In the note on the DTC information chart (Figure 3), it says that “a functional CAN fault code is set due to an implausible CAN INPUT signal”. Underneath this, it says that “At least one of the signals from control unit ‘A1 – Instrument Cluster (IC)’ was detected as implausible.” What can we do with this information? Let’s flesh that out for a moment.
Is this a physical signal fault we seek to find, or are we dealing with a fuel level signal (sensor data) within the CAN data message that is missing or corrupted? Unfortunately, the answer to this is subject to interpretation and this could get us in trouble with this diagnostic.
First, the actual CAN messages that are referred to here are encoded CAN data packets. Practicing technicians are not provided the information, tools or training to decode these messages into text to understand their content and, for the most part, don’t really need it. This is by design, as the software coding, network gateway routing, translation of messages, priority and data content make up part of the OEM’s patented autonomy in manufacturing. The secret sauce, as they say.
This information is not published or shared, even with dealer technicians. But there is a way to track this down and isolate the faulting module, node or wiring, albeit isolating the fault this way is far more time consuming and more difficult than it needs to be with the lack of actionable information provided on the data packets. More on this in a moment.
Secondly, notice that the DTC derives from the ME module. DTC U145700’s code description states that the IC (Instrument Cluster) has not received a Fuel Level signal from the Rear SAM module. This means that essentially, the technician is asked to try to isolate which of the three modules (or is it wiring?) is faulty. What is not called out here at all is the sending unit that originally produces the signal that feeds into the Rear SAM. Theoretically, the Rear SAM then configures a CAN data message reporting the fuel level signal input to the ME and the IC via CAN messages. If the sensor itself was delivering implausible data, the Rear SAM should set a DTC.
And lastly, notice that there are 2 seemingly conflicting pieces of information here that might catch the astute technician’s attention: The DTC heading specifically states that the IC did not receive a Fuel Level signal from the Rear SAM. However, further on in the same DTC chart, it states that at least one of the signals from the IC was detected as implausible.
Hmmm. One statement says the IC is not receiving a signal from the Rear SAM, and one statement saying there is an implausible signal from the IC. So, if you’re the tech, which is it? In this situation, what tactics could we deploy to actually figure this out? When faced with this type of recurring code, and the fact that most of our answers are hiding in the ether of data packets we can’t understand or read, we would perform 2 tactical steps here to try to isolate the fault.
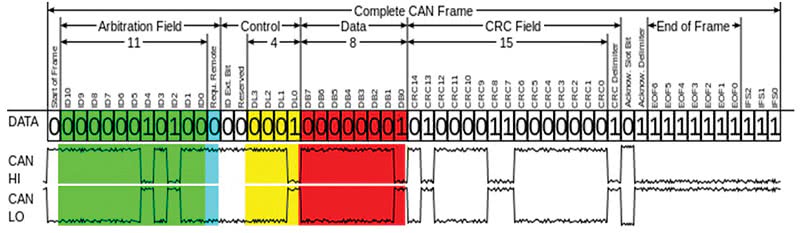
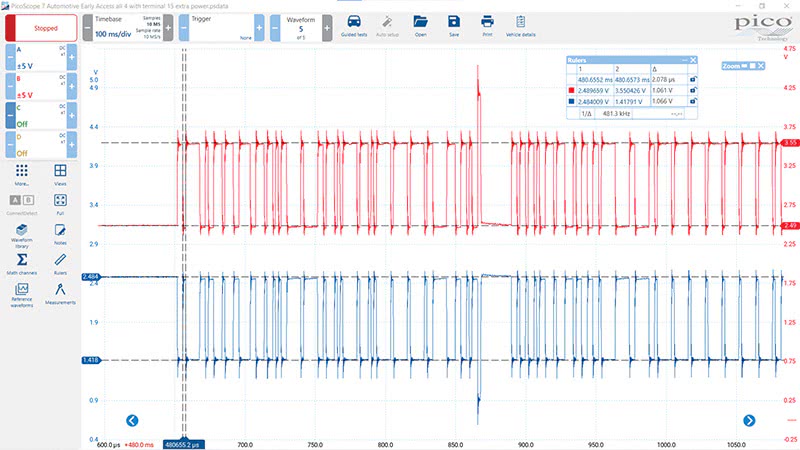
The first would be to utilize a lab scope to view and measure the live physical voltage and current activity, or signals on the CAN bus. Here, we can determine if the communication stream is physically normal (represented in Figure 4), meaning that we can determine with a good degree of specificity whether or not there is a physical problem in the wires, termination of the bus, or we can detect a CAN node or module’s internal fault, as seen in Figure 5.
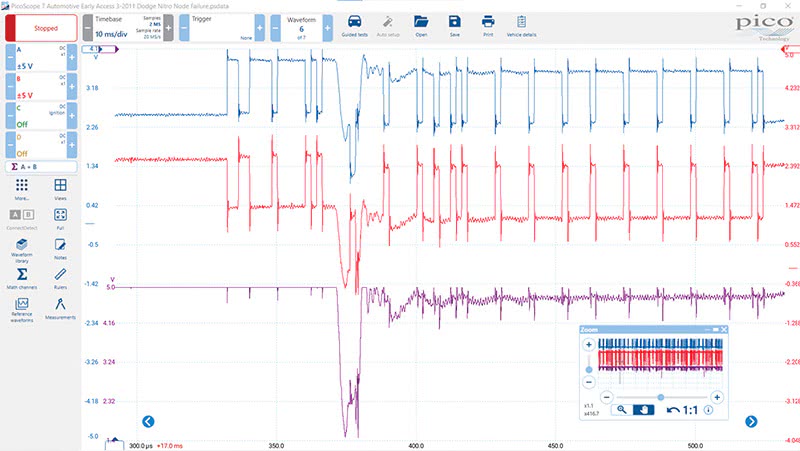
We often do this type of testing with the scope rigged to the vehicle for road testing, because as we mentioned before, rarely if ever do we get the fault to occur when testing statically in the bay unless it is already a failed part or circuit coming in the door. Also, with the live CAN waveform, we can measure the protocol rules to see if there are any violations. Describing the protocol rules for CAN and other protocols is beyond the scope of this article but please refer to StarTuned article “Network Nightmares: Is There a Different Way?” for a more in-depth discussion on this subject.
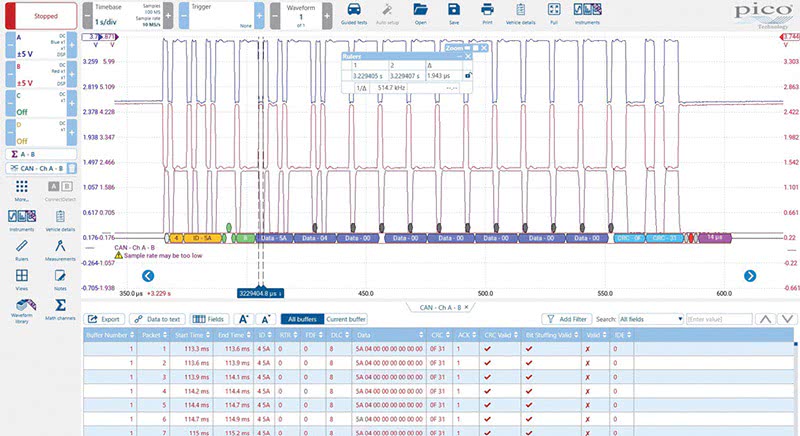
The protocol rules, specifically the proper transmission of the bit rate, arbitration fields, CRC fields, acknowledgement fields and end of frame activity, as well as the bit stuffing rule is where we concentrate our efforts in looking for packet violations. Once we find the rule-breaking packet (or string of packets), we then use a serial bus decoder (such as SD Scan, part of XENTRY Diagnosis) to determine the message IDs of the rogue packets. Then, once we have the failed message IDs identified, we begin the process of module isolation to remove the offending message IDs off the bus. Once we’ve disconnected the module producing the failed messages, we know that we have now located our rogue module and the CAN bus returns to normal. See Figure 4.
A Tactical Approach to an Engine Drivability Code
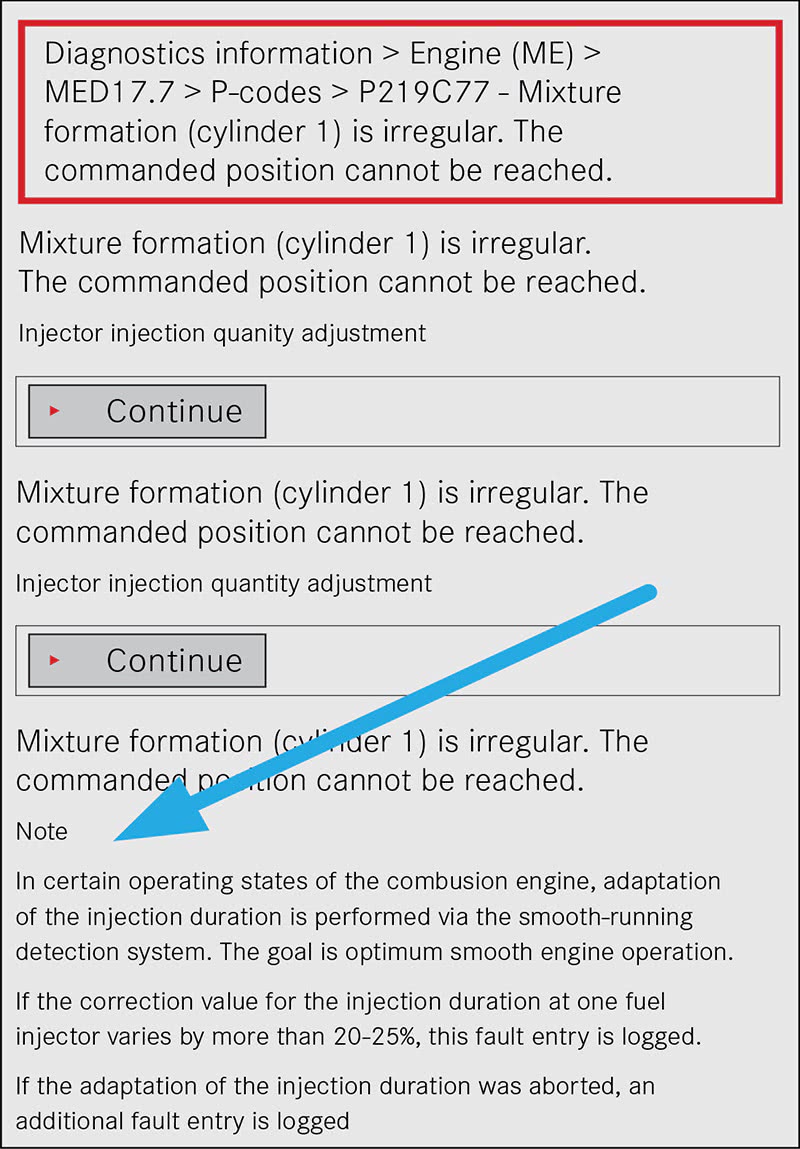
Another example of a commonly used tactical approach involves solving a DTC P219C77 on the same 2015 E350. DTCs like this one can really bite you without a tactical approach. As a matter of fact, if we consider the sheer number of hours required to perform all of the checks called out in this particular DTC flow chart, one had better have a good tactical approach here, or you might spend most of a week’s productive days of diagnostics only to return a no condition found result or, worse, end up with a brandy-new set of injectors the car didn’t need at the end of it all. Let’s walk through the strategic approach provided within this DTC chart and see how a tactical approach forms up which might improve accuracy and time.
The notes called out at the bottom of Figure 7 are quite helpful and informative. They note that in “certain operating states” the injectors are trimmed by the smooth-running detection system. If the correction value for one injector varies by 20-25% the P219C77 fault is logged. We would want to refer to the Smooth Running PIDS in the ME to gather this data.
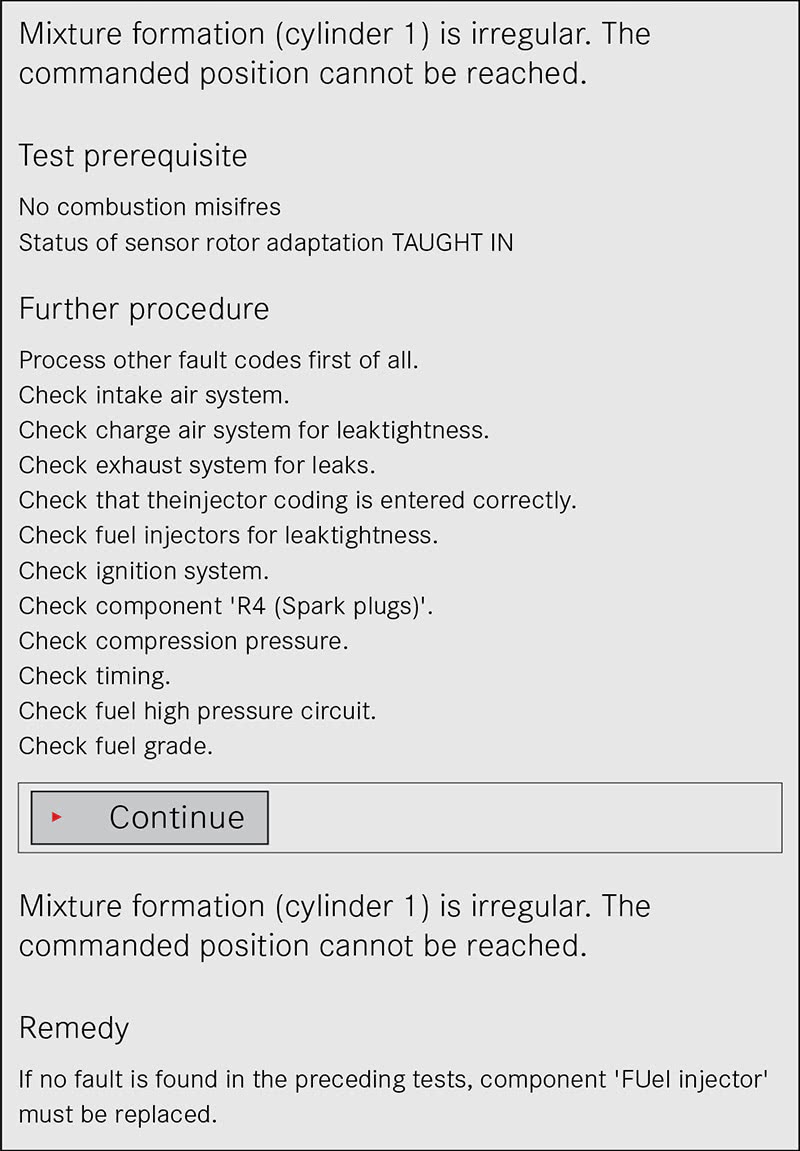
The other test prerequisite is that the status of the sensor rotor adaptation must be taught in. Let’s assume here that it is. Under the further procedures section, we are asked to perform a huge amount of testing and checking, as seen in Figure 8.
Do we really go ahead and perform all of these prescribed tasks completely and correctly, so as to be accurate with the injector replacement call that follows, assuming the statement at the bottom of Figure 8 that states “If no fault is found in the preceding tests, component Injector must be replaced”? Uncertainty in this answer is where we can see techs get a couple of parts replacements in before we get serious about properly diagnosing the problem.
A quick time estimation on the list of tests for diagnosing this code can be considered extensive. We’ll spare the details, but perhaps five to seven hours of diagnostic checks? Isn’t there an easier and more accurate way to see most of this, all at once and on one screen? We think so, and we use these techniques daily to untangle the tougher ones.
Our usual tactical approach here attempts to get as many of these answers above as possible in the most accurate way and in the shortest amount of time. Here, we would set up a multiple signals test, including the in-cylinder compression waveform to accomplish most of this DTC’s list of checks in a single shot.
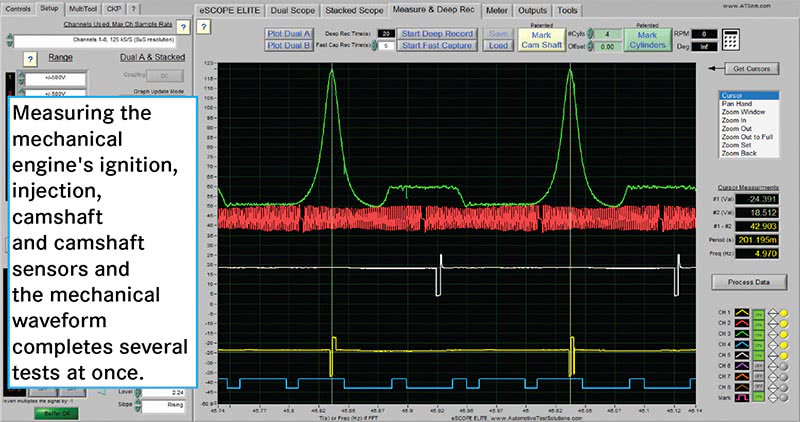
The cool thing here is that when we do it this way, we can usually confirm with a high degree of specificity and accuracy whether or not our ME-derived signals are in sync with the mechanical engine and are properly timed to the piston’s movement. This helps to isolate the source of the fault quickly, in cases where we can get the fault to occur while we have possession of the vehicle.
TIP: Record this test and save the file when the car is not acting up and we now have a known good signal profile for the vehicle to model against when it does come back in faulting. Taking the time to set up your tactical approach this way pays dividends either way and is a diagnostic win-win all the way around.
Another advantage to deploying this kind of test methodology prior to the disconnection of components and testing as prescribed by the DTC charts is to avoid a very common testing mistake. The disturbance of connectors and components for testing can often lead us to unknowingly fix the fault we’re looking for simply by disconnecting something to test it. Consider this when deciding the order of your tactical testing approach, especially when tracking down intermittent faults.
As you may have observed from the images and the discussion, displaying each of these signals together and observing their voltages and signal behavior against the mechanical waveform both tests and confirms most of the voltage, signal performance and mechanical checks asked for in our P219C77 DTC chart.
This testing tactic captures the answers all at once and dynamically. In this way, we create a good chance of being able to locate and identify the faulting circuit or mechanical problem quickly and accurately. This type of test set up on our 2015 E350 would quickly bear out the answers to the following tests in the DTC chart: the spark plug test, the ignition system test (signal and voltage performance) the mechanical engine timing test, the compression test, the fuel injection timing and duration, vacuum, backpressure and more—all at once.

It is NOT easy to find any of these faults today, as a lot of the physical proof of the fault is often lost in the ether of inter-module packet transfer over network lines, therefore invisible to the technician in most cases even with extensive physical testing. This is where a smart technician learns to develop a keen tactical approach, depending upon what combinations of conditions he or she sees when initially evaluating the fault.
The diagnosis information provided by Mercedes-Benz is useful in finding a vehicle fault in almost every case. But in those occasional cases where the problem is one that wasn’t anticipated by the designers, we sometimes have to think out of the box. When we lean strictly on OEM supplied DTC charts and scan tool data to make diagnostic judgements, we often create our own diagnostic disasters. We do this by virtue of unnecessarily running down several DTC flow charts and ending up running ourselves in circles, especially in the case of intermittent faults. This often leads to frustrated guesswork, even for the best of techs, and this never ends well.
In practice, you’re just guessing without physical testing. Both your research and strategic entry to the diagnostic, combined with a well-designed tactical approach to the vehicle’s suspected fault can make all the difference between sweet successes and frustrating failures in complex diagnostics.


0 Comments